
Reason to trust
How Our News is Made
Strict editorial policy that focuses on accuracy, relevance, and impartiality
Ad discliamer
Morbi pretium leo et nisl aliquam mollis. Quisque arcu lorem, ultricies quis pellentesque nec, ullamcorper eu odio.
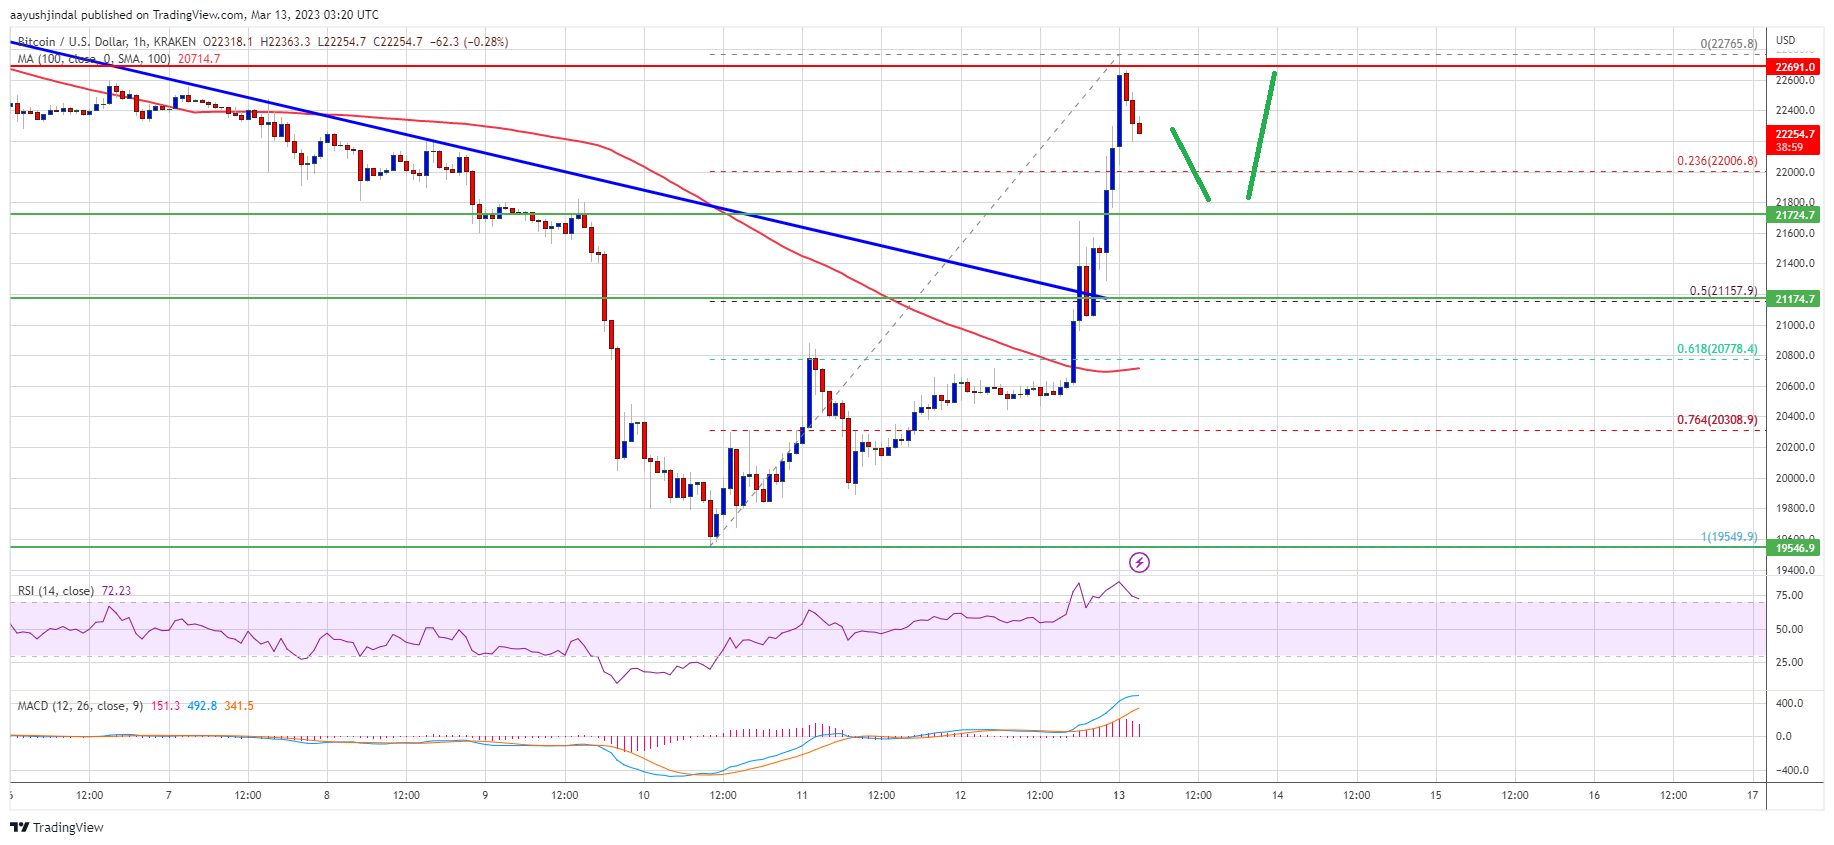
Bitcoin price surged over 10% and cleared the $22,000 resistance. BTC must surpass $22,600 and $22,800 to continue higher in the near term.
- Bitcoin started a strong increase above the $21,500 resistance zone.
- The price is trading above $22,000 and the 100 hourly simple moving average.
- There was a break above a major bearish trend line with resistance near $21,250 on the hourly chart of the BTC/USD pair (data feed from Kraken).
- The pair could face a strong selling interest near $22,600 and $22,800.
Bitcoin Price Surges Above $22K
Bitcoin price found a strong support near the $19,500 zone. BTC formed a base and started a major increase above the $20,000 resistance zone.
There was a clear move above the $20,500 and $21,200 resistance levels. Besides, there was a break above a major bearish trend line with resistance near $21,250 on the hourly chart of the BTC/USD pair. The pair even broke the $21,500 resistance zone.
Bitcoin price is trading above $22,000 and the 100 hourly simple moving average. A high is formed near $22,765 and the price is now correcting lower.
It is trading well above the 23.6% Fib retracement level of the upward move from the $19,549 swing low to $22,765 high. An immediate resistance is near the $22,600 level. The next major resistance is near the $22,800 zone.
Source: BTCUSD on TradingView.com
A close above the $22,800 resistance might start a decent increase in the coming days. The next key resistance is near the $23,200 zone, above which the price might gain bullish momentum and test $24,000.
Dips Supported in BTC?
If bitcoin price fails to clear the $22,600 resistance, it could correct lower. An immediate support on the downside is near the $22,000 zone.
The next major support is near the $21,750 zone, below which the price might drop to $21,150 or the 50% Fib retracement level of the upward move from the $19,549 swing low to $22,765 high. The next major support is near the $20,800 level and the 100 hourly simple moving average. Any more losses might send the price towards the $20,000 level.
Technical indicators:
Hourly MACD – The MACD is now losing pace in the bullish zone.
Hourly RSI (Relative Strength Index) – The RSI for BTC/USD is now in the overbought zone.
Major Support Levels – $22,000, followed by $21,750.
Major Resistance Levels – $22,600, $22,800 and $23,200.


