
Reason to trust
How Our News is Made
Strict editorial policy that focuses on accuracy, relevance, and impartiality
Ad discliamer
Morbi pretium leo et nisl aliquam mollis. Quisque arcu lorem, ultricies quis pellentesque nec, ullamcorper eu odio.
Bitcoin price gained pace and was able to clear $16,500. BTC must settle above $17,000 to start a real recovery in the near term.
- Bitcoin started an upside correction and climbed above the $16,500 resistance.
- The price is trading above $16,400 and the 100 hourly simple moving average.
- There was a break above a major bearish trend line with resistance near $16,220 on the hourly chart of the BTC/USD pair (data feed from Kraken).
- The pair could continue to rise if it settles above the $17,000 resistance zone.
Bitcoin Price Recovers
Bitcoin price formed a decent support base above the $15,500 support zone. BTC remained well bid and started an upside correction above the $16,000 resistance.
There was a clear move above the 50% Fib retracement level of the main drop from the $16,795 swing high to $15,470 low. Besides, there was a break above a major bearish trend line with resistance near $16,220 on the hourly chart of the BTC/USD pair.
Bitcoin price is now trading above $16,400 and the 100 hourly simple moving average. It is also well above the 76.4% Fib retracement level of the main drop from the $16,795 swing high to $15,470 low.
On the upside, an immediate resistance is near the $16,800 level. The first major resistance is near the $17,000 zone. A successful daily close above the $17,000 resistance might start a real recovery wave. The next major resistance is near $17,500, above which the price could gain pace for a move towards the $18,000 zone.
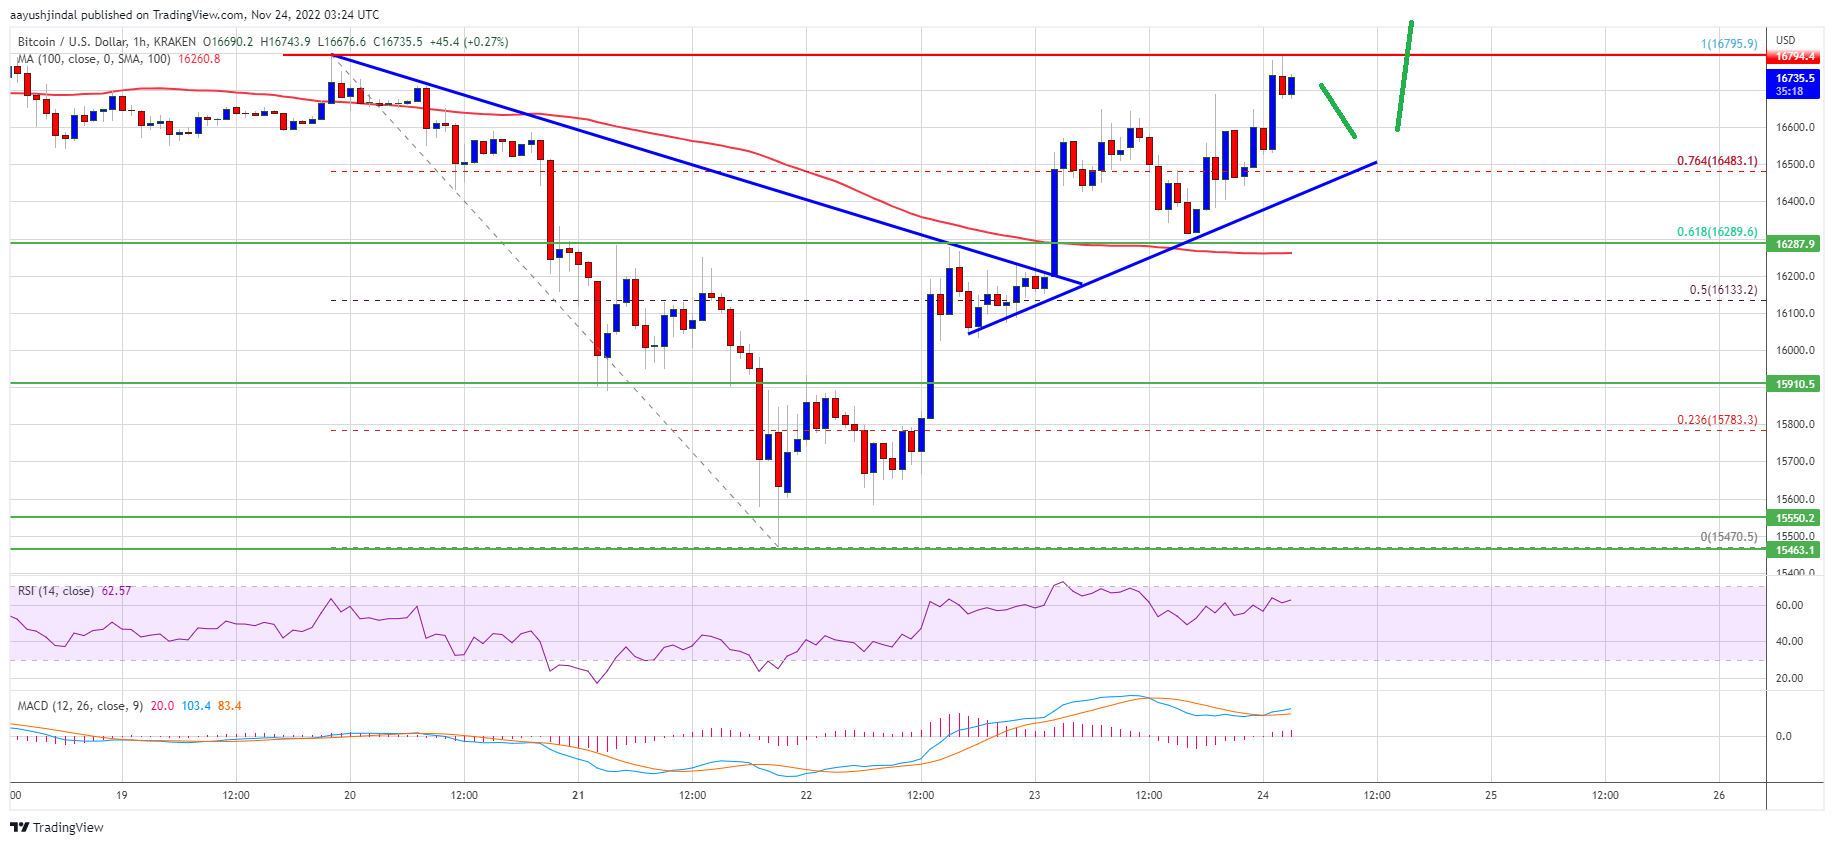
Source: BTCUSD on TradingView.com
An intermediate resistance could be $17,650. It is near the 1.618 Fib extension level of the main drop from the $16,795 swing high to $15,470 low.
Fresh Drop in BTC?
If bitcoin fails to settle above the $17,000 resistance zone, it could start another decline. An immediate support on the downside is near the $16,500 level and a connecting bullish trend line on the same chart.
The next major support is near the $16,250 zone and the 100 hourly simple moving average, below which the price might gain bearish momentum. In the stated case, the price might drop towards the $15,500 support zone.
Technical indicators:
Hourly MACD – The MACD is now gaining pace in the bullish zone.
Hourly RSI (Relative Strength Index) – The RSI for BTC/USD is now above the 50 level.
Major Support Levels – $16,500, followed by $16,250.
Major Resistance Levels – $16,800, $17,000 and $18,000.