
Reason to trust
How Our News is Made
Strict editorial policy that focuses on accuracy, relevance, and impartiality
Ad discliamer
Morbi pretium leo et nisl aliquam mollis. Quisque arcu lorem, ultricies quis pellentesque nec, ullamcorper eu odio.
Bitcoin price is stuck in a tiny range above the $25,900 support. BTC could start a decent increase if there is a close above $26,200 and then $26,500.
- Bitcoin is struggling to clear the $26,500 resistance zone.
- The price is trading below $26,200 and the 100 hourly Simple moving average.
- There is a connecting bearish trend line forming with resistance near $26,070 on the hourly chart of the BTC/USD pair (data feed from Kraken).
- The pair could attempt a fresh increase if it clears $26,150 and $26,200.
Bitcoin Price Eyes Fresh Increase
Bitcoin price tried to settle above the $26,500 resistance level. However, BTC failed to stay above $26,500 and started a fresh decline.
There was a move below the $26,250 pivot level. The price declined below the 50% Fib retracement level of the upward move from the $25,360 swing low to the $26,780 high. It seems like the price is now stuck in a tiny range above the $25,900 support zone.
Bitcoin is now trading below $26,200 and the 100 hourly Simple moving average. There is also a connecting bearish trend line forming with resistance near $26,070 on the hourly chart of the BTC/USD pair.
On the upside, immediate resistance is near the $26,100 level, the trend line, and the 100 hourly Simple moving average. The first major resistance is now near the $26,200 level, above which the price might rise toward the $26,500 resistance.
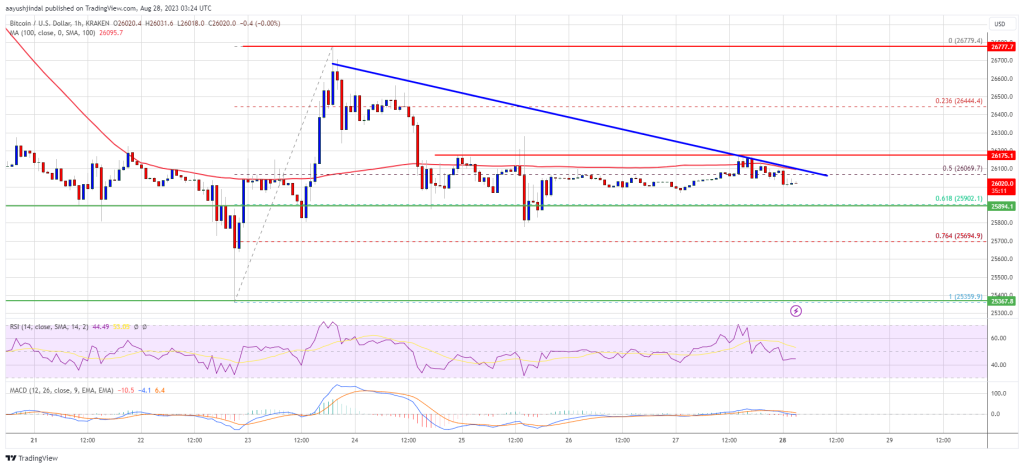
Source: BTCUSD on TradingView.com
To start a strong increase, the price must settle above the $26,500 resistance. In the stated case, the price could test the $27,000 level. Any more gains might set the pace for a larger increase toward $27,800.
More Losses In BTC?
If Bitcoin fails to clear the $26,200 resistance, it could continue to move down. Immediate support on the downside is near the $25,900 zone or the 61.8% Fib retracement level of the upward move from the $25,360 swing low to the $26,780 high.
The next major support is near the $25,400 level. A downside break below the $25,400 level might push the price further lower. In the stated case, the price could drop toward $24,800.
Technical indicators:
Hourly MACD – The MACD is now losing pace in the bearish zone.
Hourly RSI (Relative Strength Index) – The RSI for BTC/USD is now below the 50 level.
Major Support Levels – $25,900, followed by $25,400.
Major Resistance Levels – $26,200, $26,500, and $27,000.