
Reason to trust
How Our News is Made
Strict editorial policy that focuses on accuracy, relevance, and impartiality
Ad discliamer
Morbi pretium leo et nisl aliquam mollis. Quisque arcu lorem, ultricies quis pellentesque nec, ullamcorper eu odio.
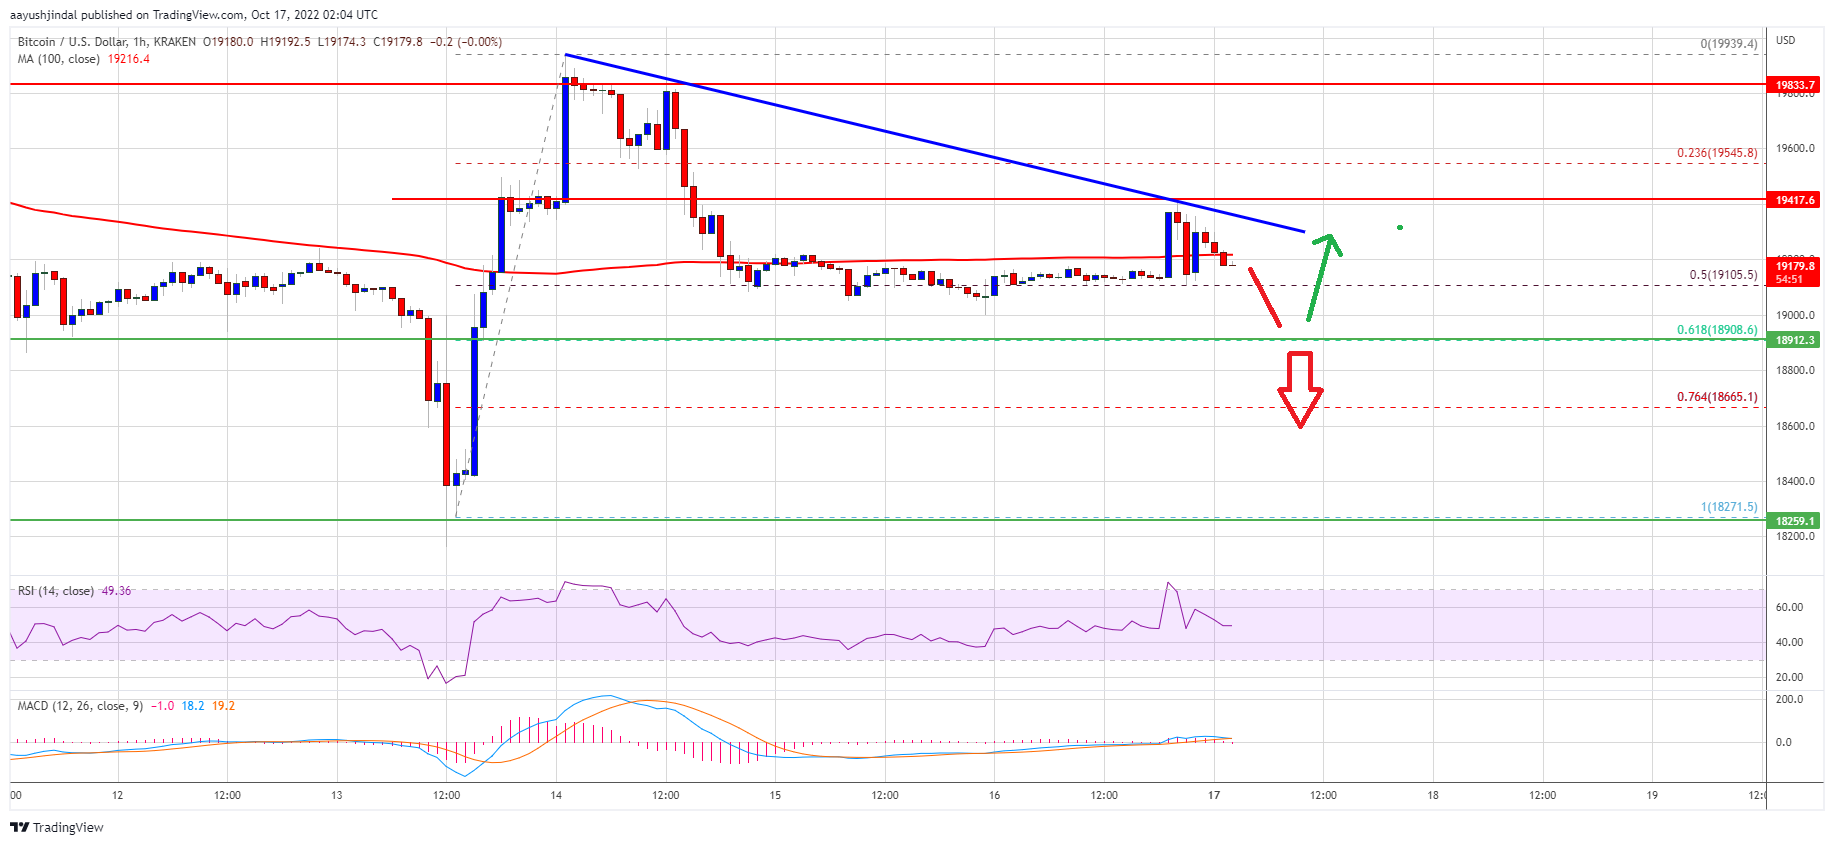
Bitcoin price struggled to clear the $20,000 resistance zone against the US Dollar. BTC might decline, but there is a key support waiting near the $18,900 zone.
- Bitcoin failed to gain momentum for a move above the $20,000 resistance zone.
- The price is trading below $19,400 and the 100 hourly simple moving average.
- There is a key bearish trend line forming with resistance near $19,250 on the hourly chart of the BTC/USD pair (data feed from Kraken).
- The pair could move down further to test the $18,900 support zone in the near term.
Bitcoin Price Trims Gains
Bitcoin price attempted a decent increase above the $19,500 resistance zone. BTC even climbed above the $19,800 level, but the bears were active near the $20,000 resistance zone.
The price traded as high as $19,939 before there was a fresh decline. There was a drop below the $19,500 and $19,400 levels. The bears even pushed the price below the 50% Fib retracement level of the upward move from the $18,271 swing low to $19,939 high.
Bitcoin price is now trading below $19,400 and the 100 hourly simple moving average. There is also a key bearish trend line forming with resistance near $19,250 on the hourly chart of the BTC/USD pair.
On the upside, an immediate resistance is near the $19,220 level. The first major resistance sits near the $19,250 level and the trend line. A clear move above the trend line resistance might pump the price towards the $19,500 resistance zone.
Source: BTCUSD on TradingView.com
The main resistance is still near the $20,000 zone. Any more gains might start a steady increase towards the $21,200 resistance zone.
Dips Limited in BTC?
If bitcoin fails to rise above the $19,250 resistance zone, it could continue to move down. An immediate support on the downside is near the $19,000 zone.
The next major support is near the $18,900 zone. It is near the 61.8% Fib retracement level of the upward move from the $18,271 swing low to $19,939 high. A downside break below the $18,900 support zone might increase selling pressure. In the stated case, the price could decline towards the $18,500 support zone.
Technical indicators:
Hourly MACD – The MACD is now gaining pace in the bearish zone.
Hourly RSI (Relative Strength Index) – The RSI for BTC/USD is now near the 50 level.
Major Support Levels – $19,000, followed by $18,900.
Major Resistance Levels – $19,250, $19,500 and $20,000.