
Reason to trust
How Our News is Made
Strict editorial policy that focuses on accuracy, relevance, and impartiality
Ad discliamer
Morbi pretium leo et nisl aliquam mollis. Quisque arcu lorem, ultricies quis pellentesque nec, ullamcorper eu odio.
Bitcoin price is consolidating above $29,500. BTC could start a decent increase if it clears the $30,200 resistance zone in the near term.
- Bitcoin is struggling to gain bullish momentum from the $29,500 level.
- The price is trading below $30,100 and the 100 hourly Simple moving average.
- There is a key bearish trend line forming with resistance near $30,020 on the hourly chart of the BTC/USD pair (data feed from Kraken).
- The pair could start a steady increase if there is a close above the $30,200 resistance.
Bitcoin Price Holds Support
Bitcoin price remained well-bid above the $29,500 level. BTC formed a support base and recently corrected a few points higher. There was a minor increase above the$29,850 resistance zone.
The price climbed above the 50% Fib retracement level of the key drop from the $30,447 swing high to the $29,500 low. However, the bears are still active near the $30,050 level. There is also a key bearish trend line forming with resistance near $30,020 on the hourly chart of the BTC/USD pair.
Bitcoin is now trading below $30,100 and the 100 hourly Simple moving average. Immediate resistance is near the trend line zone. The first major resistance is near the $30,085 level. It is close to the 61.8% Fib retracement level of the key drop from the $30,447 swing high to the $29,500 low.
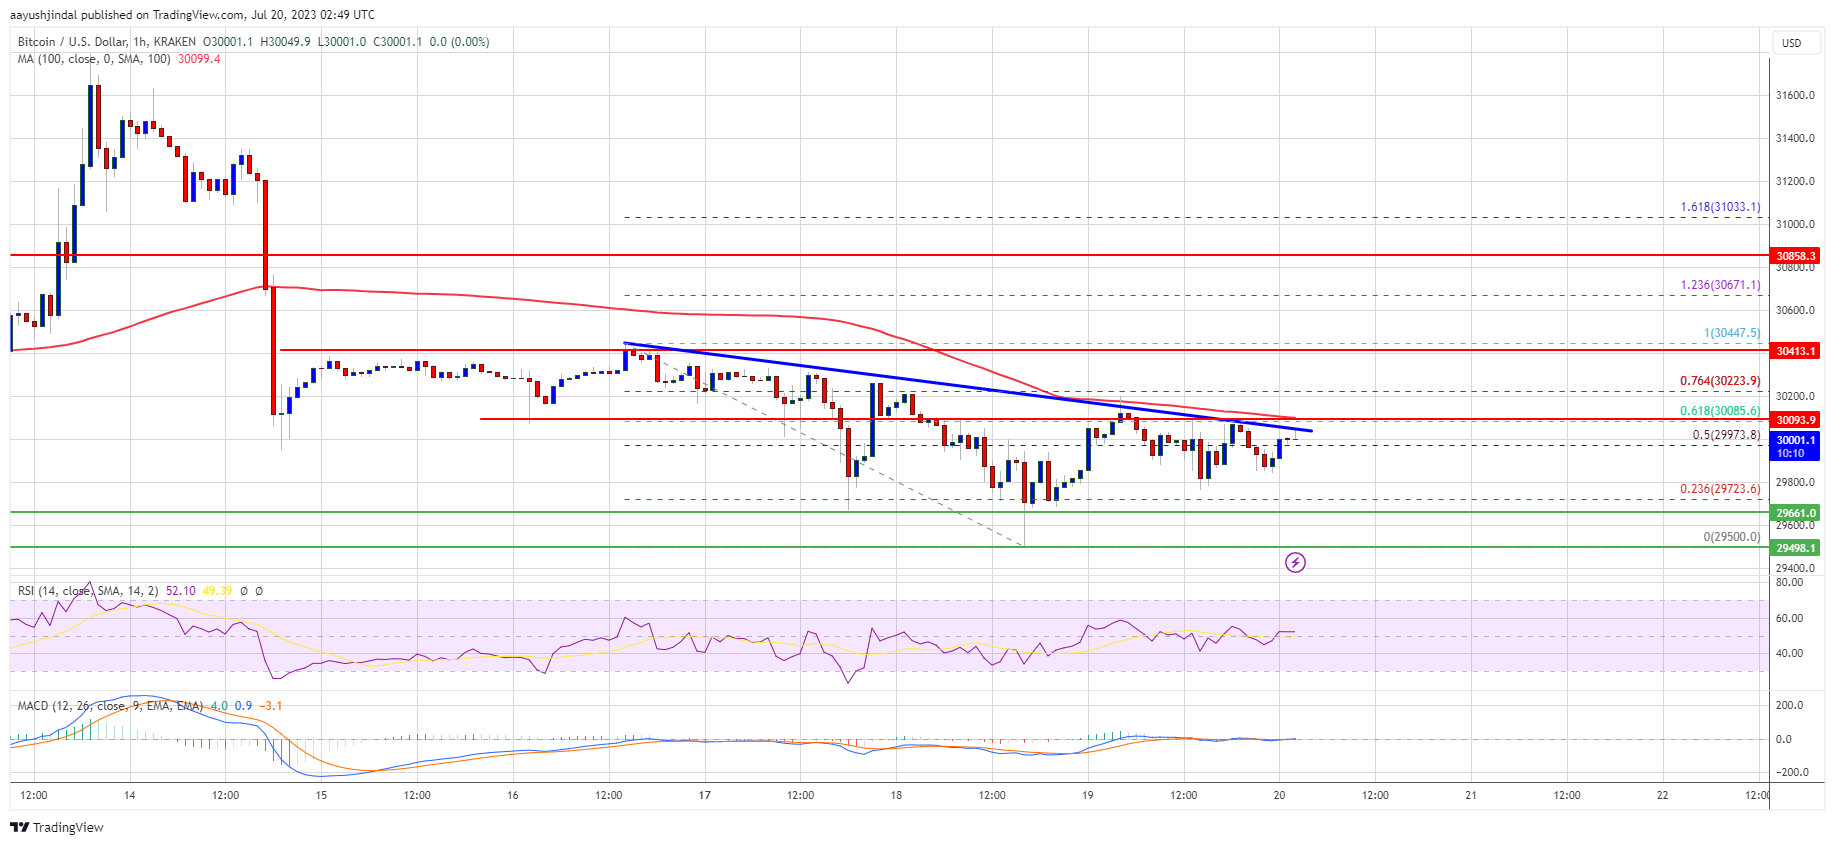
Source: BTCUSD on TradingView.com
The next major resistance is near $30,450. A close above the $30,450 level might start a fresh increase. In the stated case, the price could rise toward the $30,850 level. Any more gains could open the doors for a move toward the $31,200 resistance zone.
More Losses in BTC?
If Bitcoin fails to clear the $30,085 resistance, it could continue to move down. Immediate support on the downside is near the $29,800 level.
The next major support is near the $29,500 level, below which the price could continue to move down. In the stated case, the price could drop toward the $29,200 support zone. Any more losses might send the price toward the $28,400 level in the near term.
Technical indicators:
Hourly MACD – The MACD is now losing pace in the bearish zone.
Hourly RSI (Relative Strength Index) – The RSI for BTC/USD is now above the 50 level.
Major Support Levels – $29,650, followed by $29,500.
Major Resistance Levels – $30,085, $30,450, and $31,200.