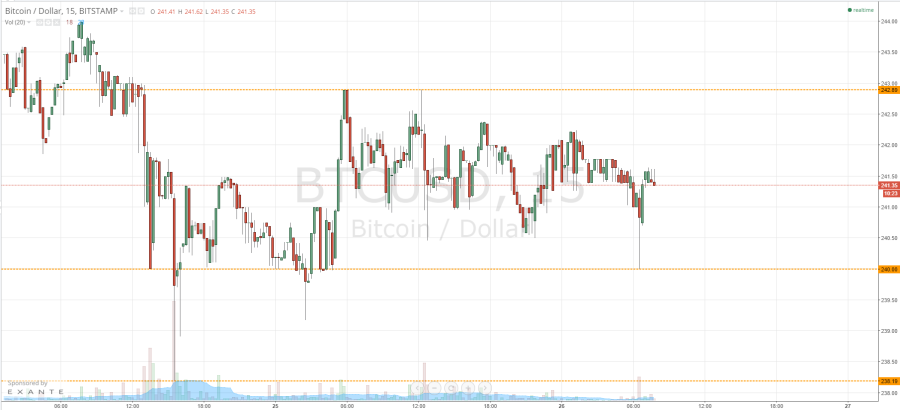
Over the last week or so, we have seen some pretty volatile movement in the bitcoin price during the European session. The overarching momentum has been to the downside, and a couple of classical technical charting patterns have fueled the bears to bring us to this level at which we now trade. With all this said, looking at price action overnight on Thursday, are we likely to see a reversal of the overarching momentum as we head into the weekend, or will the bears remain in control throughout next week? Further to this, what are the key levels that we are watching in the bitcoin price to try and gain insight into any potential bias as far as getting into the market according to our scalp strategy is concerned? Take a quick look at the chart.
As the chart shows, we are currently trading between a pretty tight range of 240 flat to the downside – serving as in term support temporarily – and 242.89 to the upside – serving as in term resistance for today’s session. These are the two levels that will be watching during Europe. We are currently trading mid-range, so we will initially look for a break above 242.89 (in term resistance) to validate an upside target medium-term at 245 flat. This is a pretty close run target, so a tight stop loss is required; somewhere around 242 will maintain a positive risk reward profile and take us out of the trade in the event of a bias reversal.
Looking the other way, and assuming the bearish momentum continues, if we get a run down towards 240 flat we will look for a break below this level to present us with a medium-term bearish bias and an initial downside target of 238.19. Once again, this is a pretty close run target, and on these sorts of scalp trades a tight stop loss is necessary; somewhere around 241 will just about make the trade attractive from a risk management perspective while leaving us enough room to spike up and back out of the range in the event that we get a short-term reversal.
Charts courtesy of Trading View


