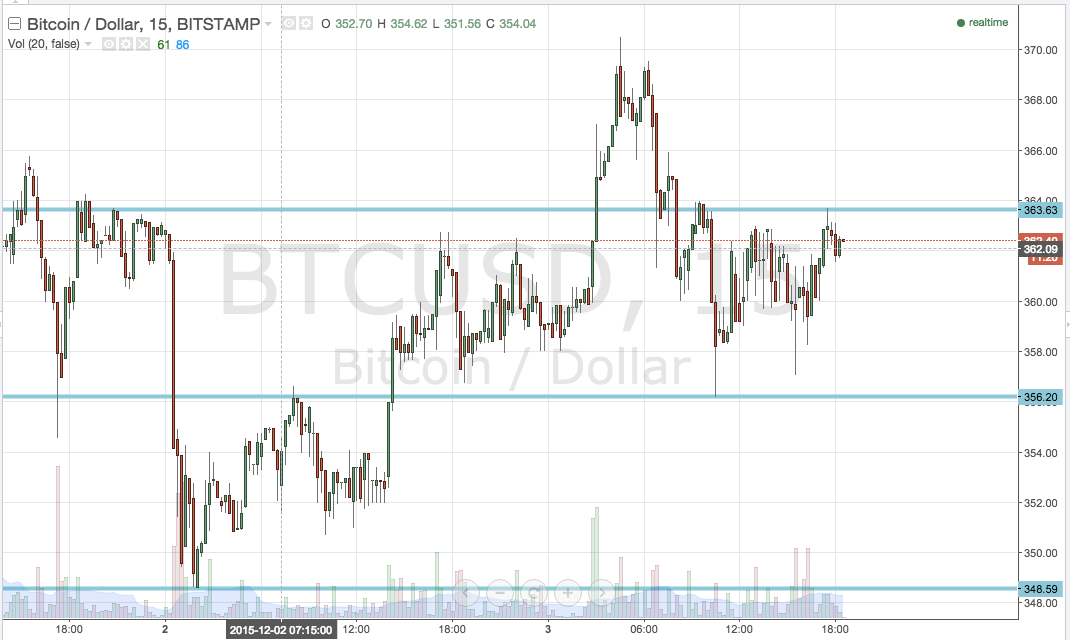
In this morning’s bitcoin price analysis, we noted that we would be bringing our intrarange strategy in to play for today’s session. We widened out predefined range and planned to go long at support and short at resistance, with a stop loss just on the other side of our entry. Action has now matured throughout the European afternoon, and we are heading into a fresh Asian session shortly. In light of this, let’s take a look at how our strategy fared, and set up our positions in anticipation of any volatility tonight. As always, check out the chart to get an idea of what we are watching.

As you can see from the chart, action today has been relatively flat. We remained well within our predefined range, but failed to reach either in term support or resistance, meaning we aren’t in (and haven’t got into) any trades so far today. With this in mind, we are tightening up our range tonight. This doesn’t mean we cant use our intrarange, just that we will have to keep our risk a little tighter if we take a position. In term support sits at 356.20, while in term resistance comes in at 363.63.
We will look for a correction from resistance to put us short towards in term support, or a close above resistance to validate an upside entry towards 370 flat, with a stop just the other side of our entries in both instances.
Looking the other way, if we close below in term support, it will put us short towards 348.59, with a stop loss at 358 giving us plenty of reward on some relatively tight risk. From an intrarange perspective, if we bounce from support it will put us long towards resistance at 363.63, with a stop around 354 defining our risk on this one.
Charts courtesy of Trading View


Hi, I find this analysis very interesting. Currently, I’am doing a college research about Bitcoin as an investment asset.
I hope you can help by clarifying some doubts I got from reading to see if my interpretation is correct.
In
the paragraph before the last, you state: “We will look for a
correction from resistance to put us short towards in term support”.
I
take it as: Down-trend from $363.63 expecting to reach or be close to $356.20. Correct?
“or a close above resistance to validate an upside entry towards 370 flat”.
At the end of Assian session you expect to be above $363.63 which will indicate an up-trend. Correct?
“Looking the other way, if we close blow in term support it will put us short towards 348.59”
It is also possible that at the end of the Assian session price will drop until it reaches $348.59. Correct?
Thank you very much for your time.