
Reason to trust
How Our News is Made
Strict editorial policy that focuses on accuracy, relevance, and impartiality
Ad discliamer
Morbi pretium leo et nisl aliquam mollis. Quisque arcu lorem, ultricies quis pellentesque nec, ullamcorper eu odio.
Bitcoin price is consolidating losses below the $26,500 level. BTC is showing bearish signs and remains at risk of a fresh decline toward $25,000.
- Bitcoin is struggling to recover above the $26,600 resistance zone.
- The price is trading below $26,500 and the 100 hourly Simple moving average.
- There is a short-term bullish trend line forming with support near $26,050 on the hourly chart of the BTC/USD pair (data feed from Kraken).
- The pair could continue to move down and trade below the $26,000 support.
Bitcoin Price Turns Red
Bitcoin price started a recovery wave from the $24,800 support zone. BTC managed to recover above the $25,000 and $25,500 resistance levels.
There was a move above the 23.6% Fib retracement level of the downward move from the $29,180 swing high to the $24,800 low. However, the price is facing a lot of hurdles on the upside near $26,600. It is still trading below $26,500 and the 100 hourly Simple moving average.
Besides, there is a short-term bullish trend line forming with support near $26,050 on the hourly chart of the BTC/USD pair. If Bitcoin stays above the trend line, it could attempt a recovery wave.
Immediate resistance is near the $26,400 level. The next major resistance is near $26,500 and the 100 hourly Simple moving average. A clear move above the 100 hourly Simple moving average could start a recovery wave toward the $27,000 resistance.
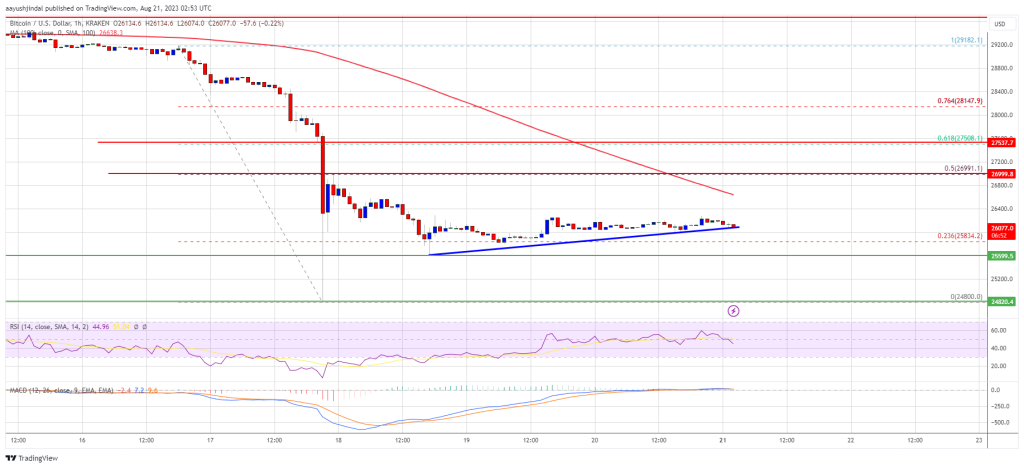
Source: BTCUSD on TradingView.com
The 50% Fib retracement level of the downward move from the $29,180 swing high to the $24,800 low is near $27,000 to act as a resistance. A close above the $27,000 resistance could start a decent increase toward the $27,500 resistance zone. Any more gains might set the pace for a larger increase toward $28,150.
Another Decline In BTC?
If Bitcoin fails to clear the $26,500 resistance, it could continue to move down. Immediate support on the downside is near the $26,000 zone and the trend line.
The next major support is near the $25,600 level. A downside break below the $25,600 level might push the price further into a bearish zone. In the stated case, the price could drop toward $25,000.
Technical indicators:
Hourly MACD – The MACD is now gaining pace in the bearish zone.
Hourly RSI (Relative Strength Index) – The RSI for BTC/USD is now below the 50 level.
Major Support Levels – $26,000, followed by $25,600.
Major Resistance Levels – $26,500, $27,000, and $27,500.