
Reason to trust
How Our News is Made
Strict editorial policy that focuses on accuracy, relevance, and impartiality
Ad discliamer
Morbi pretium leo et nisl aliquam mollis. Quisque arcu lorem, ultricies quis pellentesque nec, ullamcorper eu odio.
- A fresh yearly high was formed at $5,465 before bitcoin corrected lower against the US Dollar.
- The price started a downside correction and traded below the $5,200 support level.
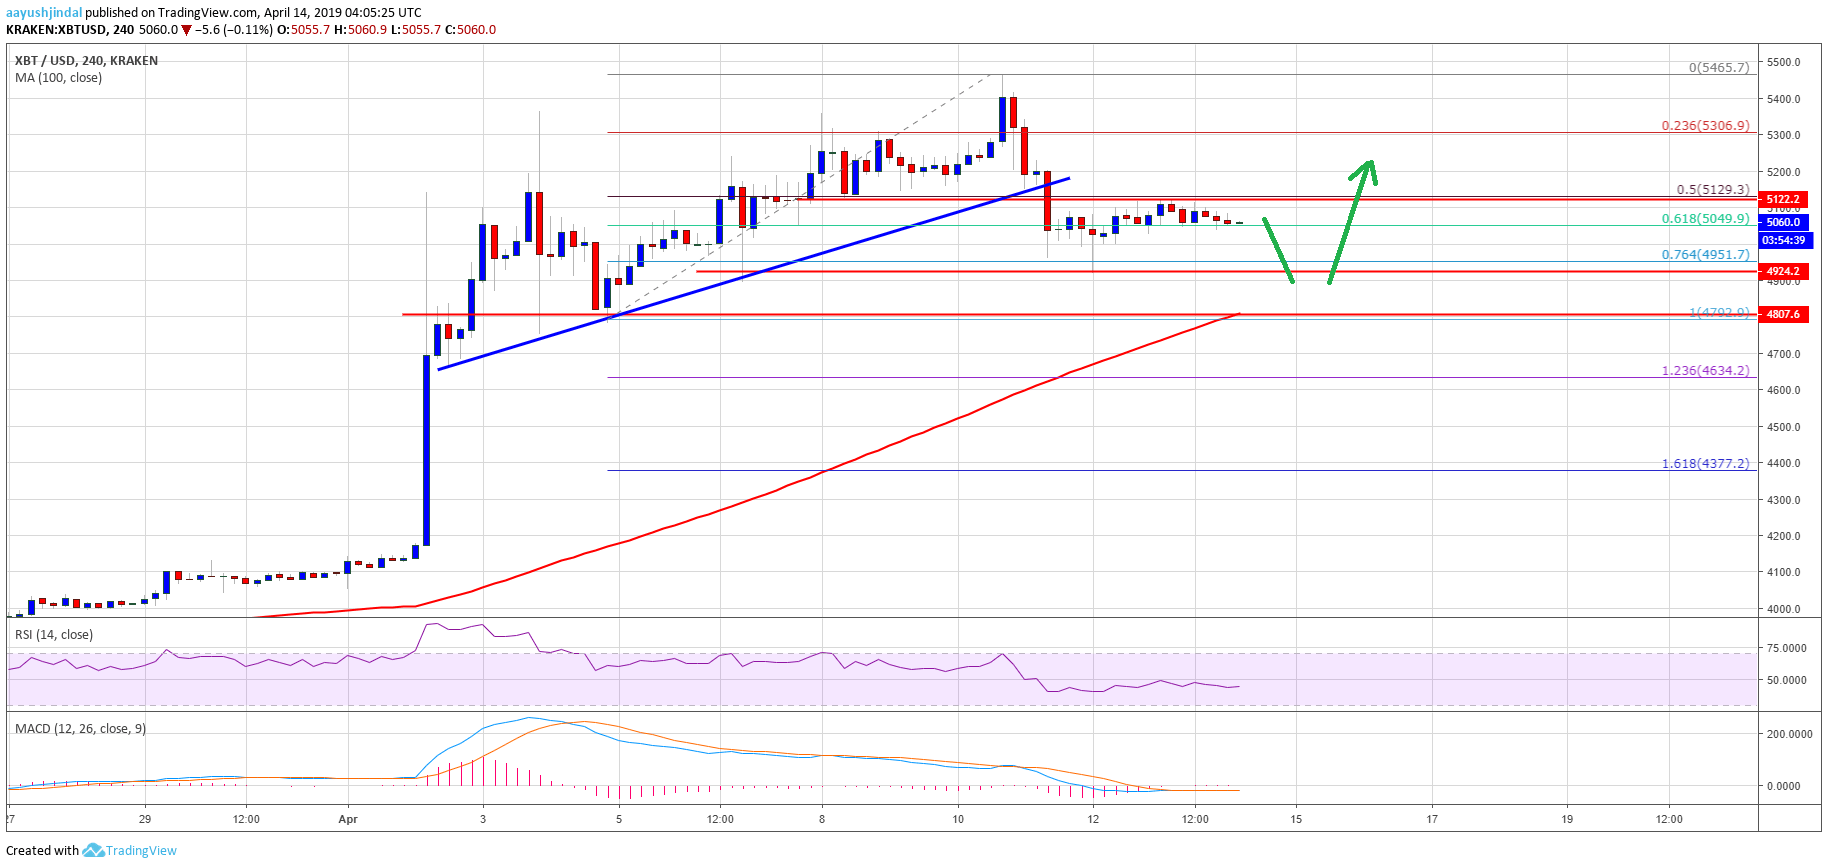
- There was a break below a major bullish trend line with support at $5,200 on the 4-hours chart of the BTC/USD pair (data feed from Kraken).
- The pair tested the $4,950 support area and it seems like there are many supports on the downside.
Bitcoin remains in a strong uptrend despite the recent correction below $5,200 against the US Dollar. BTC is likely to find buyers near soon and it could bounce back above $5,150.
Bitcoin Price Weekly Analysis (BTC)
There was a steady rise in bitcoin above the $5,350 level this past week against the US Dollar. The BTC/USD pair even broke the $5,450 level and traded to a new yearly high at $5,465. Later, there was a downside correction and the price broke the $5,400 and $5,350 support levels. Sellers gained pace once the price broke the key $5,200 support area. There was even a break below the 50% Fib retracement level of the last wave from the $4,702 low to $5,465 high.
Moreover, there was a break below a major bullish trend line with support at $5,200 on the 4-hours chart of the BTC/USD pair. Sellers pushed the price below the $5,000 level and the price tested the $4,950 support area. Besides, there was a test of the 76.4% Fib retracement level of the last wave from the $4,702 low to $5,465 high. Recently, the price recovered above the $5,050 level, but it faced a strong resistance near the $5,130 level. The stated $5,130 level was a support earlier and now it is acting as a hurdle for buyers.
It seems like there might be another downside push towards the $4,950 or $4,900 support levels before the price starts a fresh increase. The $4,800 level is also a strong support since it is a pivot area and coincides with the 100 simple moving average (4-hours). Therefore, if there are more downsides, the price is likely to remain supported near $4,900 or $4,800.
Looking at the chart, bitcoin is clearly trading in an uptrend as long as it is above $4,800 and the 100 simple moving average (4-hours). If there is a close below the 100 SMA, the price could decline towards the $4,500 level. Conversely, the price is likely to bounce back above $5,150 and $5,200 in the near term.
Technical indicators
4 hours MACD – The MACD for BTC/USD is about to move into the bullish zone.
4 hours RSI (Relative Strength Index) – The RSI for BTC/USD is placed just below the 50 level.
Major Support Level – $4,900
Major Resistance Level – $5,150