
Reason to trust
How Our News is Made
Strict editorial policy that focuses on accuracy, relevance, and impartiality
Ad discliamer
Morbi pretium leo et nisl aliquam mollis. Quisque arcu lorem, ultricies quis pellentesque nec, ullamcorper eu odio.
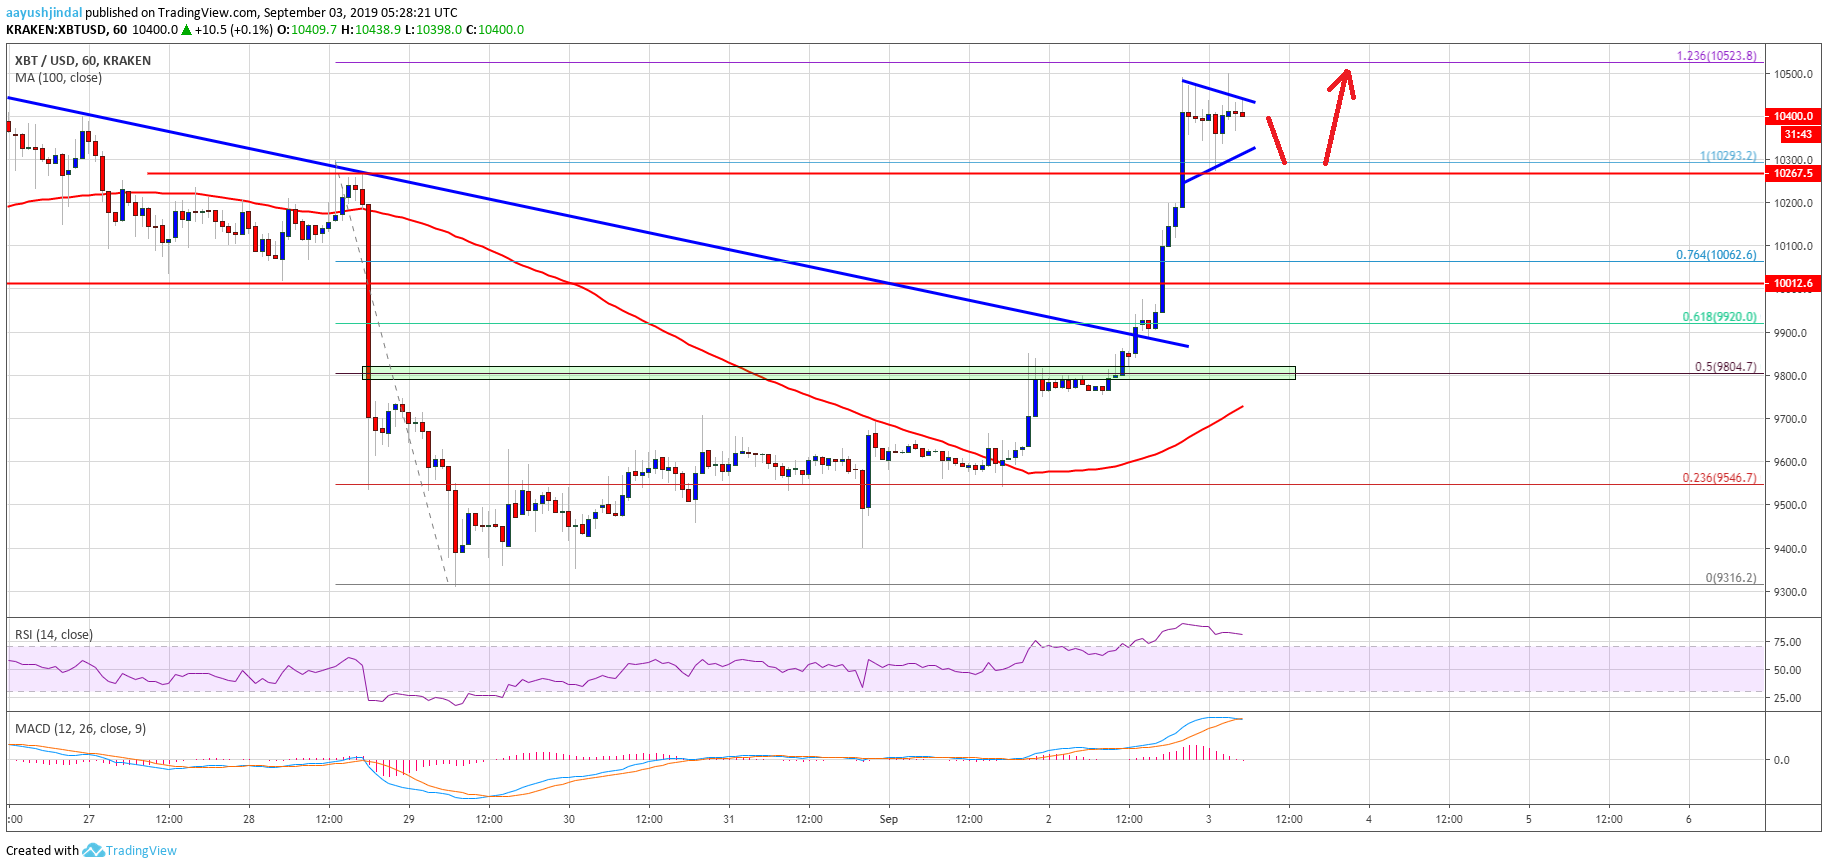
- Bitcoin price surged higher and broke the main $10,000 and $10,200 resistances against the US Dollar.
- The price is currently consolidating below the next key resistance at $10,500-$10,525.
- This week’s followed key bearish trend line was breached with resistance near $9,880 on the hourly chart of the BTC/USD pair (data feed from Kraken).
- The price is currently trading in a range and dips are likely to find bids near $10,250 and $10,100.
Bitcoin price is up more than 7% above $10,400 against the US Dollar. BTC is now facing hurdles near $10,500 and it might correct lower in the short term.
Bitcoin Price Analysis
Yesterday, we discussed a few important hurdles for BTC near the $9,900 and $10,000 levels against the US Dollar. It seems like the bulls enjoyed a strong rally since the price surged above the $10,000 resistance level. Moreover, there was a close above the $10,200 resistance and the 100 hourly simple moving average. It helped many altcoins in staging a recovery, including Ethereum, binance coin, ripple and BCH.
During the rise, this week’s followed key bearish trend line was breached with resistance near $9,880 on the hourly chart of the BTC/USD pair. Moreover, the pair climbed above the 76.4% Fib retracement level of the downward move from the $10,295 high to $9,316 low. Finally, the pair broke the last swing high at $10,295 and traded above the $10,400 resistance area.
Bitcoin tested the next major resistance near the $10,500 level. Moreover, the 1.236 Fib extension level of the downward move from the $10,295 high to $9,316 low is near the $10,525 level. Therefore, a clear break above the $10,500 and $10,525 levels could push the price towards the $11,000 barrier in the near term. At the moment, the price is consolidating in a contracting triangle above $10,300 on the same chart.
If there is a downside break below the $10,350 and $10,300 levels, the price could test the $10,250 support area. The main support on the downside is near the $10,000 level (the recent resistance area). A close back below $10,000 might push the price back in a negative zone.
Looking at the chart, bitcoin price is clearly trading in a positive zone, with a close above $10,000 and $10,200. If the bulls succeed in gaining momentum above $10,500 and $10,525, the price is likely to rally another 5%-7% and trade towards the $11,000 resistance level.
Technical indicators:
Hourly MACD – The MACD is currently reducing its bullish slope.
Hourly RSI (Relative Strength Index) – The RSI for BTC/USD is correcting lower from the overbought levels.
Major Support Levels – $10,250 followed by $10,050.
Major Resistance Levels – $10,500, $10,525 and $10,800.


