
Reason to trust
How Our News is Made
Strict editorial policy that focuses on accuracy, relevance, and impartiality
Ad discliamer
Morbi pretium leo et nisl aliquam mollis. Quisque arcu lorem, ultricies quis pellentesque nec, ullamcorper eu odio.
- Bitcoin price stayed above the $9,600 support level and climbed higher against the US Dollar.
- The price broke the $10,000 resistance and it is now testing the key $10,200 resistance.
- There was a break above a major contracting triangle with resistance near $9,910 on the hourly chart of the BTC/USD pair (data feed from Kraken).
- The price is likely to continue higher once there is a successful close above the $10,200 resistance.
Bitcoin price is gaining momentum above the $10,000 level against the US Dollar. BTC price could accelerate upsides once it clears the $10,200 resistance area.
Bitcoin Price Analysis
Yesterday, we saw fresh bearish wave in bitcoin price from the $10,200 resistance against the US Dollar. The BTC/USD pair dipped below the $9,800 support level and the 100 hourly simple moving average. Moreover, the price traded below the $9,700 level, but the $9,625 level acted as a support. It seems like the price stayed above $9,600 and a bullish trend line protected declines.
A swing low was formed near $9,627 and the price started a fresh increase. There was a break above the $9,800 and $10,000 resistance levels. Furthermore, the price settled above the $10,000 resistance and the 100 hourly simple moving average. More importantly, there was a break above a major contracting triangle with resistance near $9,910 on the hourly chart of the BTC/USD pair.
The pair ran into the key $10,200 resistance and it is currently consolidating gains. An immediate support is near the $10,080 level. The 23.6% Fib retracement level of the recent wave from the $9,627 low to $10,212 high is also near the same level. If there are more losses, the price could test the $10,000 support level. The next support is near the 50% Fib retracement level of the recent wave from the $9,627 low to $10,212 high at $9,920.
On the upside, the $10,200 area is a crucial hurdle. If there is an upside break above $10,200, the price could accelerate higher in the coming sessions. The next important resistance is near the $10,400 level, above which there are chances of more gains towards the $10,800 level.
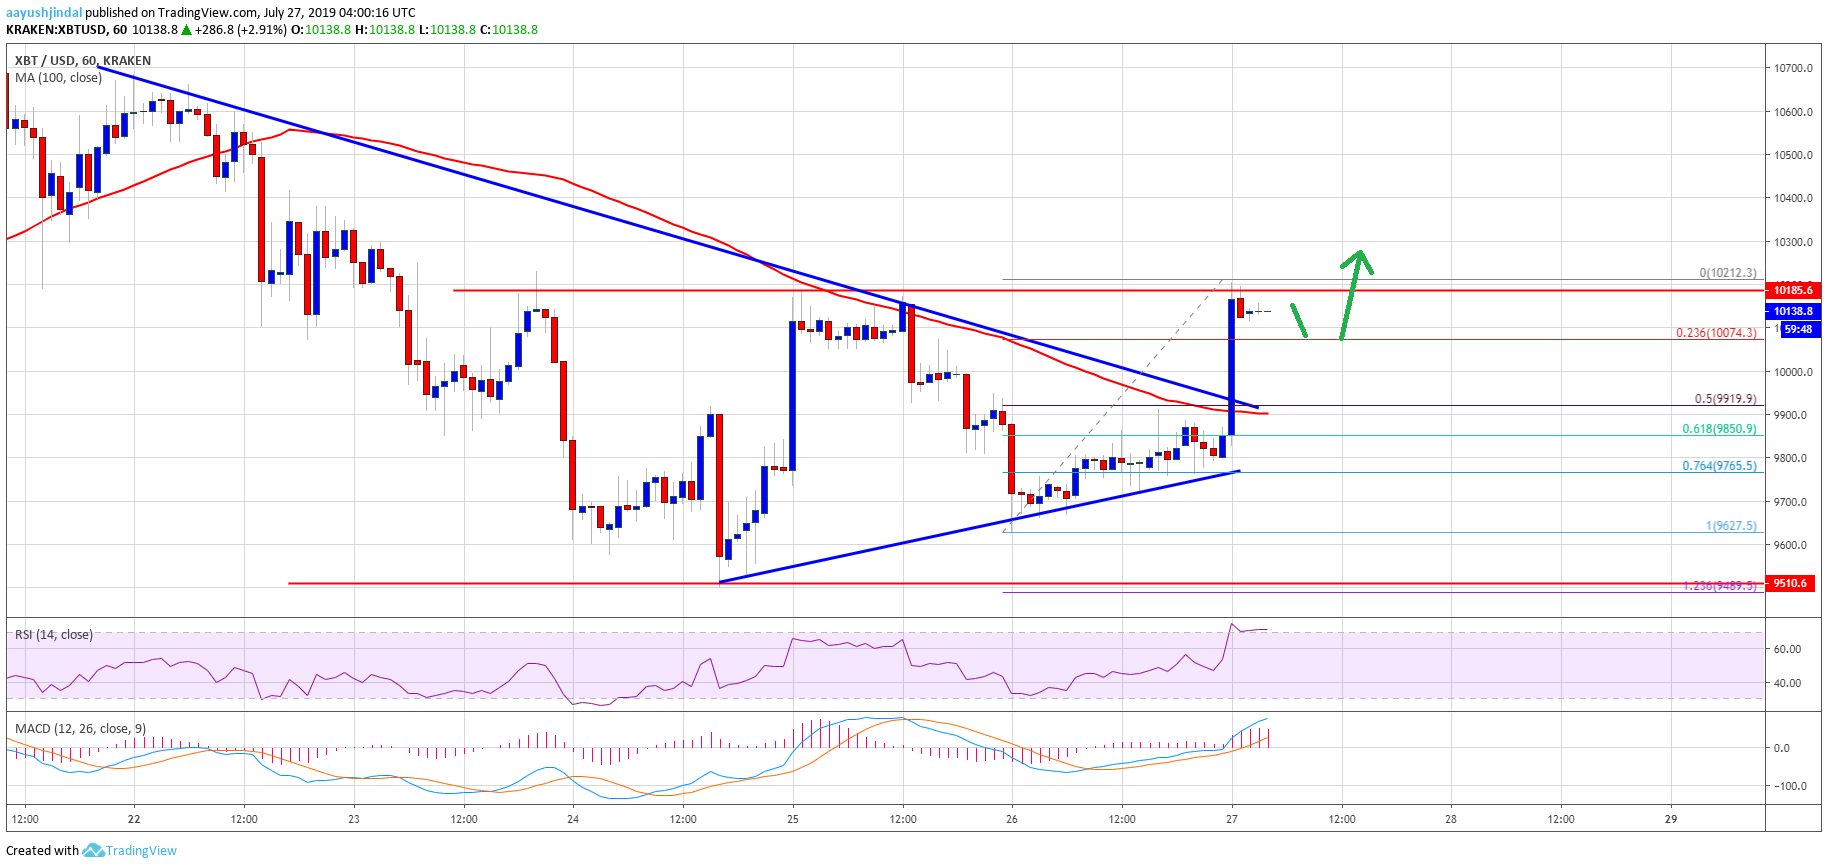
Looking at the chart, bitcoin price is facing a strong resistance near $10,200. If there is another failure near $10,200, the price could form double top and decline heavily. Conversely, a successful close above the $10,200 resistance might start a strong increase towards $10,400 and $10,800.
Technical indicators:
Hourly MACD – The MACD is gaining momentum in the bullish zone.
Hourly RSI (Relative Strength Index) – The RSI for BTC/USD is now well above the 60 level, with positive signs.
Major Support Levels – $10,080 followed by $10,000.
Major Resistance Levels – $10,200, $10,400 and $10,800.


