
Reason to trust
How Our News is Made
Strict editorial policy that focuses on accuracy, relevance, and impartiality
Ad discliamer
Morbi pretium leo et nisl aliquam mollis. Quisque arcu lorem, ultricies quis pellentesque nec, ullamcorper eu odio.
- Bitcoin price is currently consolidating above the $10,300 level against the US Dollar.
- The price seems to be struggling to break the $10,400 and $10,500 resistance levels.
- There is a breakout pattern forming with resistance near $10,400 on the hourly chart of the BTC/USD pair (data feed from Kraken).
- The price could either climb above $10,400 or it might start a fresh decline below $10,250.
Bitcoin price is holding an important support near $10,300 against the US Dollar. BTC could rise steadily towards $10,500 as long as it is above $10,250 and $10,300.
Bitcoin Price Analysis
Recently, bitcoin struggled to gain momentum above the $10,400 resistance area against the US Dollar. The last swing high was formed near $10,437 before the price started a downside correction. On the other hand, there was a solid upward move in Ethereum above the $185 and $186 resistance levels. At the outset, BTC price is trading well below the $10,400 resistance level.
The last swing low was near $10,270 and recently the price corrected higher. It broke the $10,320 and $10,350 levels, plus remained well above the 100 hourly simple moving average. Moreover, there was a break above the 50% Fib retracement level of the recent decline from the $10,437 high to $10,270 low. However, the upward move was capped by the $10,375 level.
It seems like the 61.8% Fib retracement level of the recent decline from the $10,437 high to $10,270 low is acting as a hurdles. More importantly, there is a breakout pattern forming with resistance near $10,400 on the hourly chart of the BTC/USD pair. If bitcoin breaks the trend line support near $10,300 and the 100 hourly SMA, there could be a downside extension. An immediate support is near the $10,250 level, below which the price could head towards $10,000.
Conversely, if there is an upside break above $10,400, the price could start another rise. The next major resistances are near $10,440 and $10,500. If the bulls remain in action above $10,500, the price could start a strong upward move above the $10,550 and $10,600 levels.
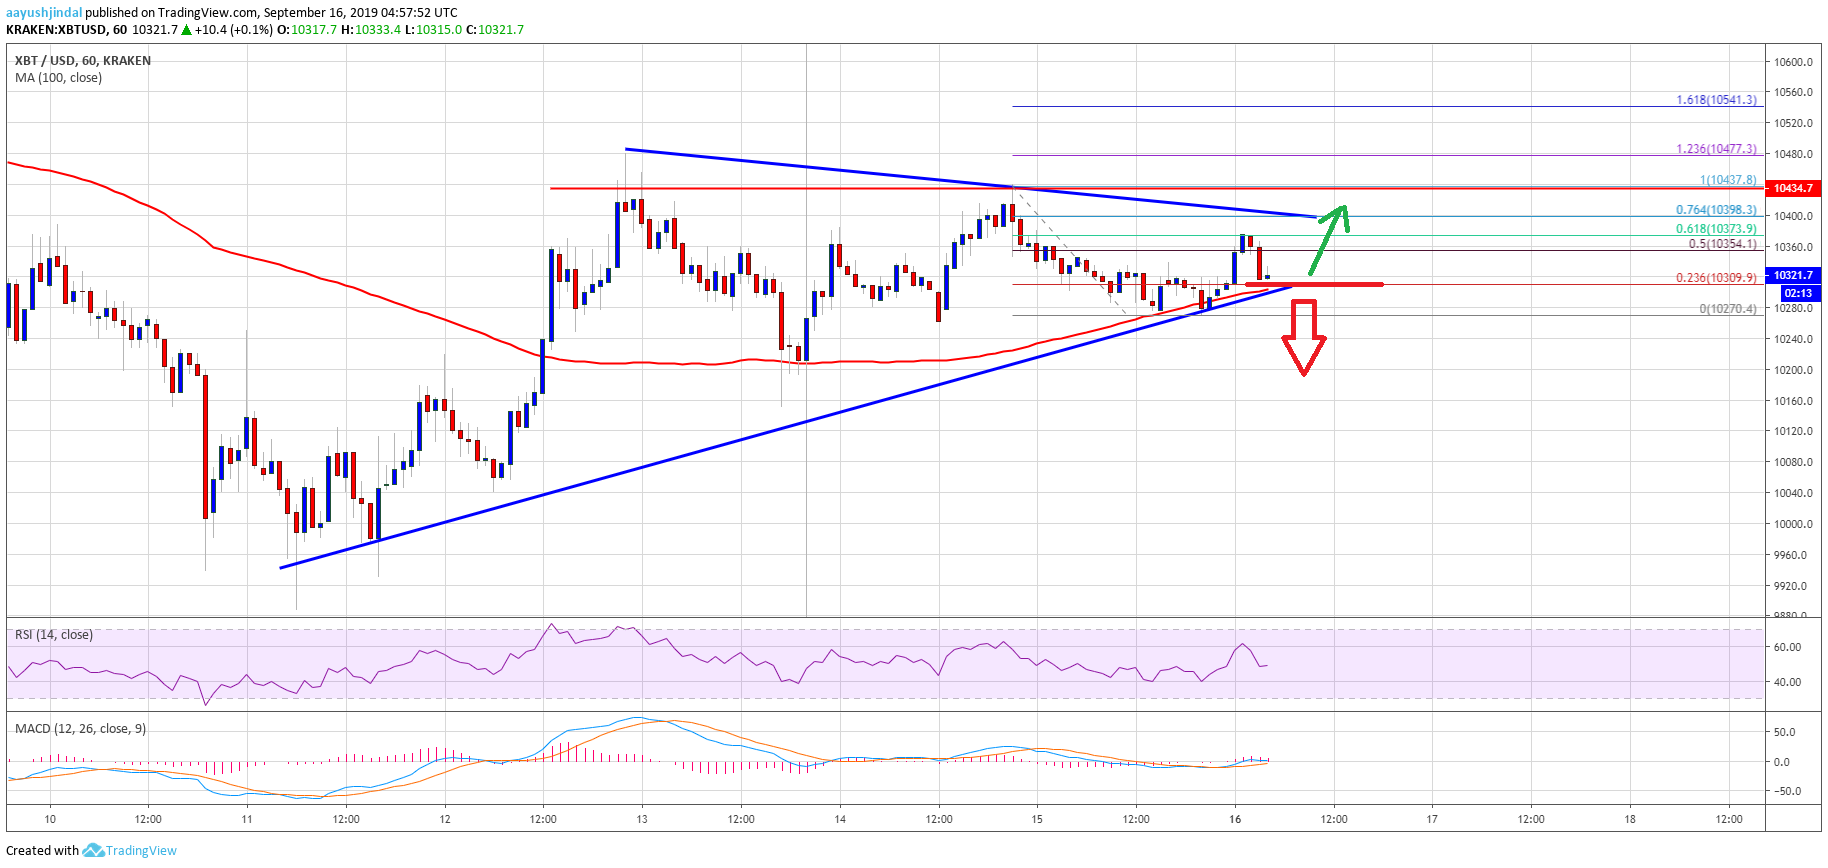
Looking at the chart, bitcoin price is clearly preparing for the next break either above $10,400 or below $10,250. The current price action suggests that the price could rise steadily towards $10,500 as long as it is above the 100 hourly SMA. If not, there are chances of a fresh drop towards the $10,000 support area.
Technical indicators:
Hourly MACD – The MACD is slowly moving back into the bearish zone.
Hourly RSI (Relative Strength Index) – The RSI for BTC/USD is moving higher towards the 50 level.
Major Support Levels – $10,300 followed by $10,250.
Major Resistance Levels – $10,400, $10,440 and $10,500.


