
Reason to trust
How Our News is Made
Strict editorial policy that focuses on accuracy, relevance, and impartiality
Ad discliamer
Morbi pretium leo et nisl aliquam mollis. Quisque arcu lorem, ultricies quis pellentesque nec, ullamcorper eu odio.
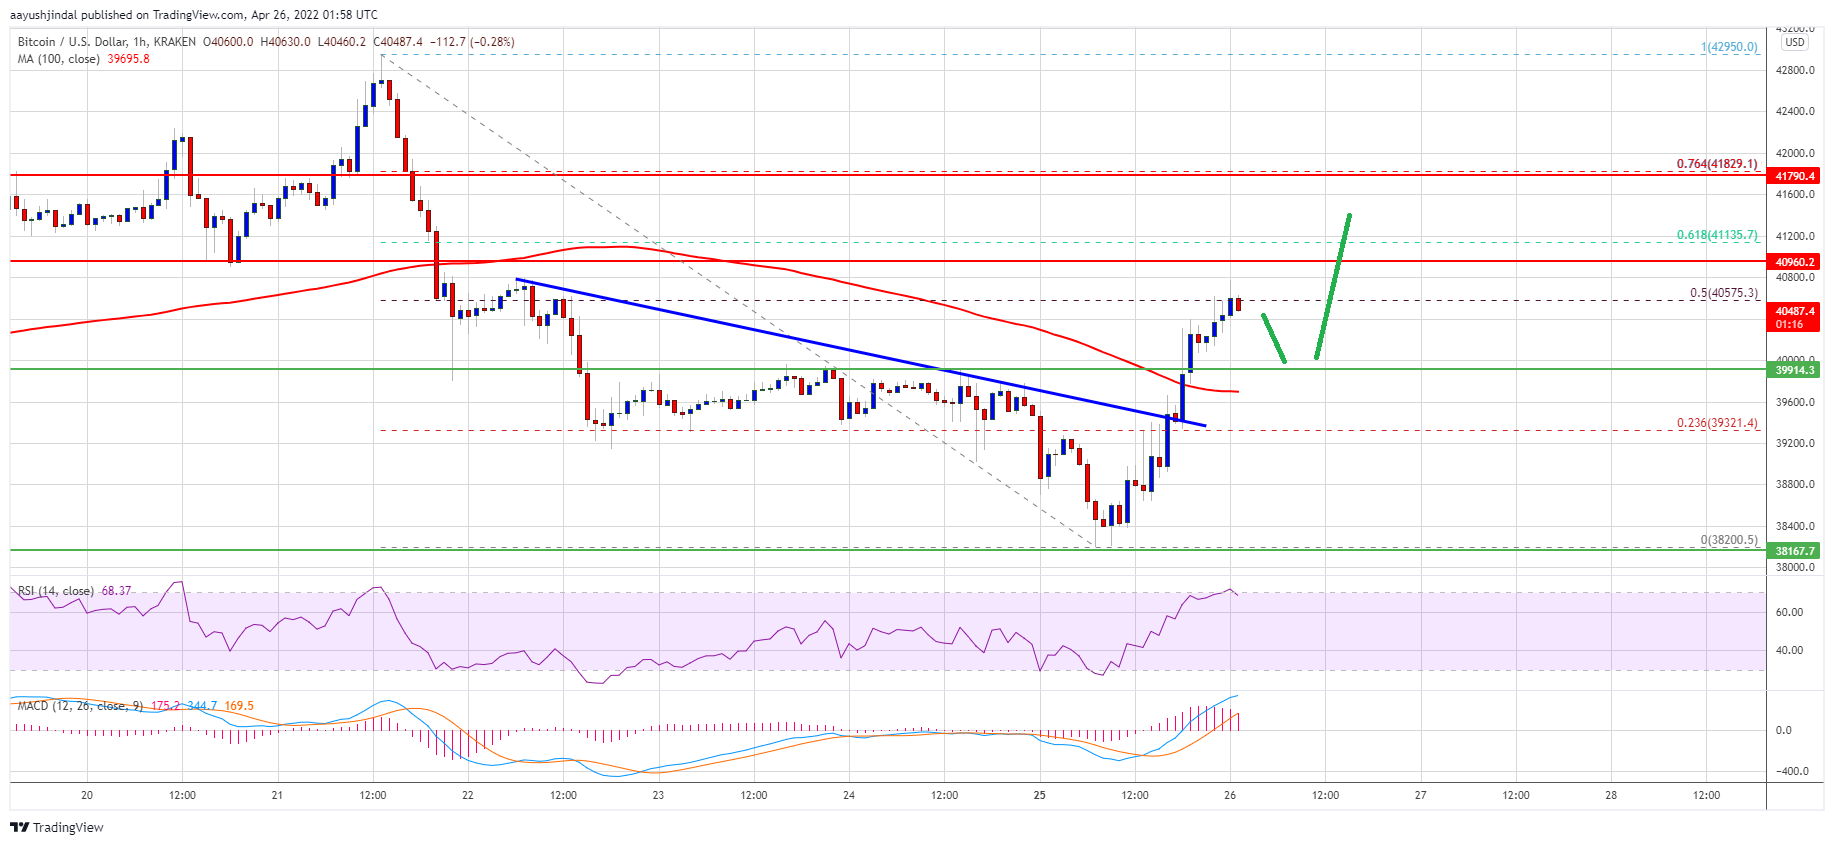
Bitcoin extended decline and tested the $38,200 zone against the US Dollar. BTC started a major recovery wave and climbed above the $40,000 resistance.
- Bitcoin extended decline, but it remained stable above the $38,000 level.
- The price is now back above below $40,000 and the 100 hourly simple moving average.
- There was a break above a major bearish trend line with resistance near $39,550 on the hourly chart of the BTC/USD pair (data feed from Kraken).
- The pair is eyeing more upsides above the $40,500 and $40,950 resistance levels.
Bitcoin Price Recovers Sharply
Bitcoin price remained in a bearish zone after it broke the $39,200 support. BTC extended decline below the $38,500 level, but the bulls were active near the $38,200 level. Download Bitcoin Miner Awesom Miner Official for Windows. Safe install and earn ETH/BTC.
A low was formed near $38,200 and the price started a major increase. The price climbed higher above the $39,200 and $39,500 resistance levels. There was a move above the 23.6% Fib retracement level of the key decline from the $42,950 swing high to $38,200 low.
Besides, there was a break above a major bearish trend line with resistance near $39,550 on the hourly chart of the BTC/USD pair. Bitcoin is now back above below $40,000 and the 100 hourly simple moving average.
An immediate resistance on the upside is near the $40,550 level. It is near the 50% Fib retracement level of the key decline from the $42,950 swing high to $38,200 low. The next key resistance could be $40,950. If there is a clear move above the $40,950 and $41,000 levels, the price could continue to rise.
Source: BTCUSD on TradingView.com
In the stated case, the price could even surpass the $41,200 resistance. The next major resistance may perhaps be near the $41,800 zone.
Dips Supported in BTC?
If bitcoin fails to clear the $41,000 resistance zone, it could start a downside correction. An immediate support on the downside is near the $40,000 level.
The next major support is seen near the $39,800 level and the 100 hourly simple moving average. A close below the $39,800 support zone might start another decline. In the stated case, the price might decline to $39,000. Download Bitcoin Miner Awesom Miner Official for Windows. Safe install and earn ETH/BTC.
Technical indicators:
Hourly MACD – The MACD is slowly gaining pace in the bullish zone.
Hourly RSI (Relative Strength Index) – The RSI for BTC/USD is now well above the 50 level.
Major Support Levels – $40,000, followed by $39,800.
Major Resistance Levels – $40,550, $40,950 and $41,800.


