
Reason to trust
How Our News is Made
Strict editorial policy that focuses on accuracy, relevance, and impartiality
Ad discliamer
Morbi pretium leo et nisl aliquam mollis. Quisque arcu lorem, ultricies quis pellentesque nec, ullamcorper eu odio.
Bitcoin price remained well supported above $9,900 and $10,000 against the US Dollar. BTC is currently recovering and approaching a major breakout zone at $10,500.
- Bitcoin is trading higher, and it surpassed the $10,200 resistance zone and he 100 hourly simple moving average.
- It is facing a major hurdle near the $10,450 and $10,500 levels.
- There is a key rising channel forming with support near $10,300 on the hourly chart of the BTC/USD pair (data feed from Kraken).
- The pair could start a strong upward move if it closes above the $10,500 and $10,600 resistance levels.
Bitcoin Price is Recovering
Recently, there was another test of the $10,000 and $9,900 support levels by bitcoin price against the US Dollar. BTC remained well supported and the bears failed to push the price below the $9,850 swing low.
It started a decent upward move and surpassed the $10,150 and $10,200 resistance levels. There was also a close above the $10,200 level and the 100 hourly simple moving average. It is now trading near the $10,450 resistance, where the bulls seem to be struggling.
If there is a downside correction, bitcoin might find support near the $10,300 level. It is close to the 23.6% Fib retracement level of the recent upward move from the $9,859 swing low to $10,441 high.
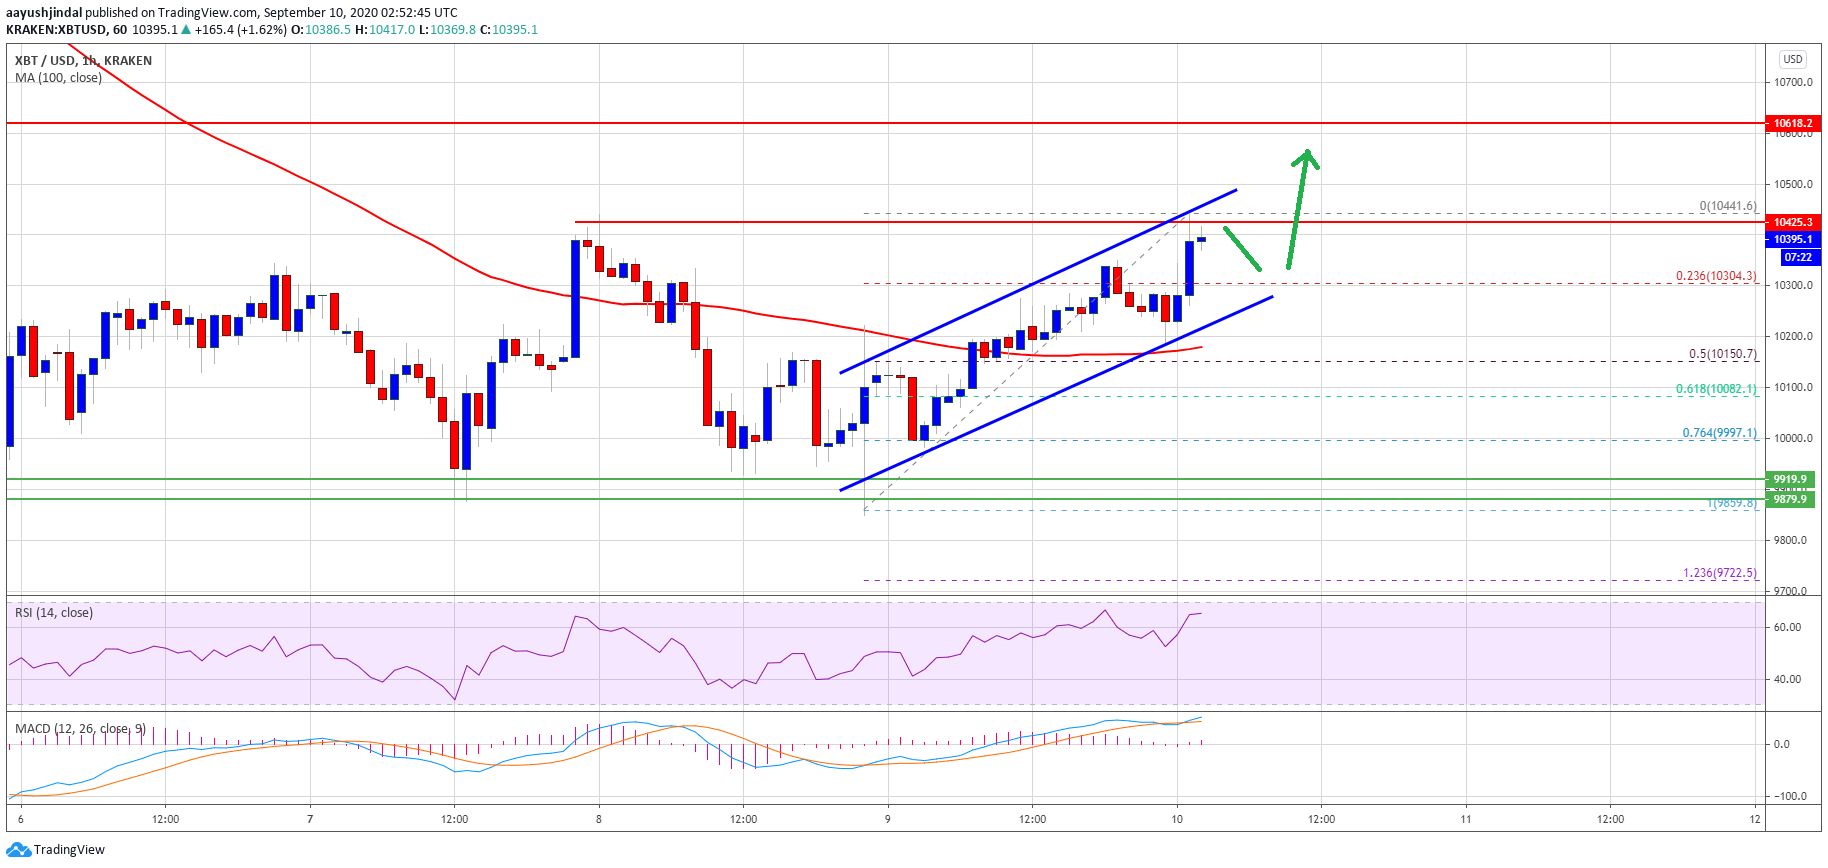
Bitcoin price trades near $10,450. Source: TradingView.com
There is also a key rising channel forming with support near $10,300 on the hourly chart of the BTC/USD pair. If there is a downside break below the channel support, the pair could test the $10,150 support level or the 100 hourly SMA.
The 50% Fib retracement level of the recent upward move from the $9,859 swing low to $10,441 high is also near the $10,150 level. On the upside, the bulls are facing a couple of important hurdles near $10,450 and $10,500 levels.
A successful close above the $10,500 resistance level may perhaps open the doors for a larger rally. The next major resistance is near $10,600, above which the bulls might aim a test of $11,000.
Another Rejection in BTC?
If bitcoin fails to clear the $10,500 resistance, there could be another downward move. The first key support is near the channel support, followed by the 100 hourly SMA at $10,150.
The main breakdown support is still near the $10,000 and $9,900 levels. A daily close below the $9,900 level may perhaps spark a sharp decline.
Technical indicators:
Hourly MACD – The MACD is showing positive signs in the bullish zone.
Hourly RSI (Relative Strength Index) – The RSI for BTC/USD is currently just above the 60 level.
Major Support Levels – $10,300, followed by $10,150.
Major Resistance Levels – $10,450, $10,500 and $10,600.