Reason to trust
How Our News is Made
Strict editorial policy that focuses on accuracy, relevance, and impartiality
Ad discliamer
Morbi pretium leo et nisl aliquam mollis. Quisque arcu lorem, ultricies quis pellentesque nec, ullamcorper eu odio.
Bitcoin price is extending its rise above $10,750 against the US Dollar. BTC is now approaching a crucial breakout zone near $10,850, $10,920, and $11,000.
- Bitcoin started a decent recovery wave above the $10,550 and $10,650 resistance levels.
- The price was able to clear the $10,750 resistance and settled above the 100 hourly simple moving average.
- Yesterday’s highlighted important rising channel is active with support near $10,720 on the hourly chart of the BTC/USD pair (data feed from Kraken).
- The pair is approaching a couple of major hurdles near $10,850, $10,920 and $11,000.
Bitcoin Price is Approaching Major Breakout Zone
Bitcoin price found support near the $10,350 zone and recently started a decent recovery wave against the US Dollar. BTC broke the $10,550 and $10,650 resistance levels to move into a short-term positive zone.
The upward move was such that the price was able to climb above the 50% Fib retracement level of the main drop from the $10,930 high to $10,387 low. The bulls were able to push the price above the $10,750 level and it tested the $10,800 resistance.
The price is currently facing selling interest near the 76.4% Fib retracement level of the main drop from the $10,930 high to $10,387 low. It seems like yesterday’s highlighted important rising channel is active with support near $10,720 on the hourly chart of the BTC/USD pair.
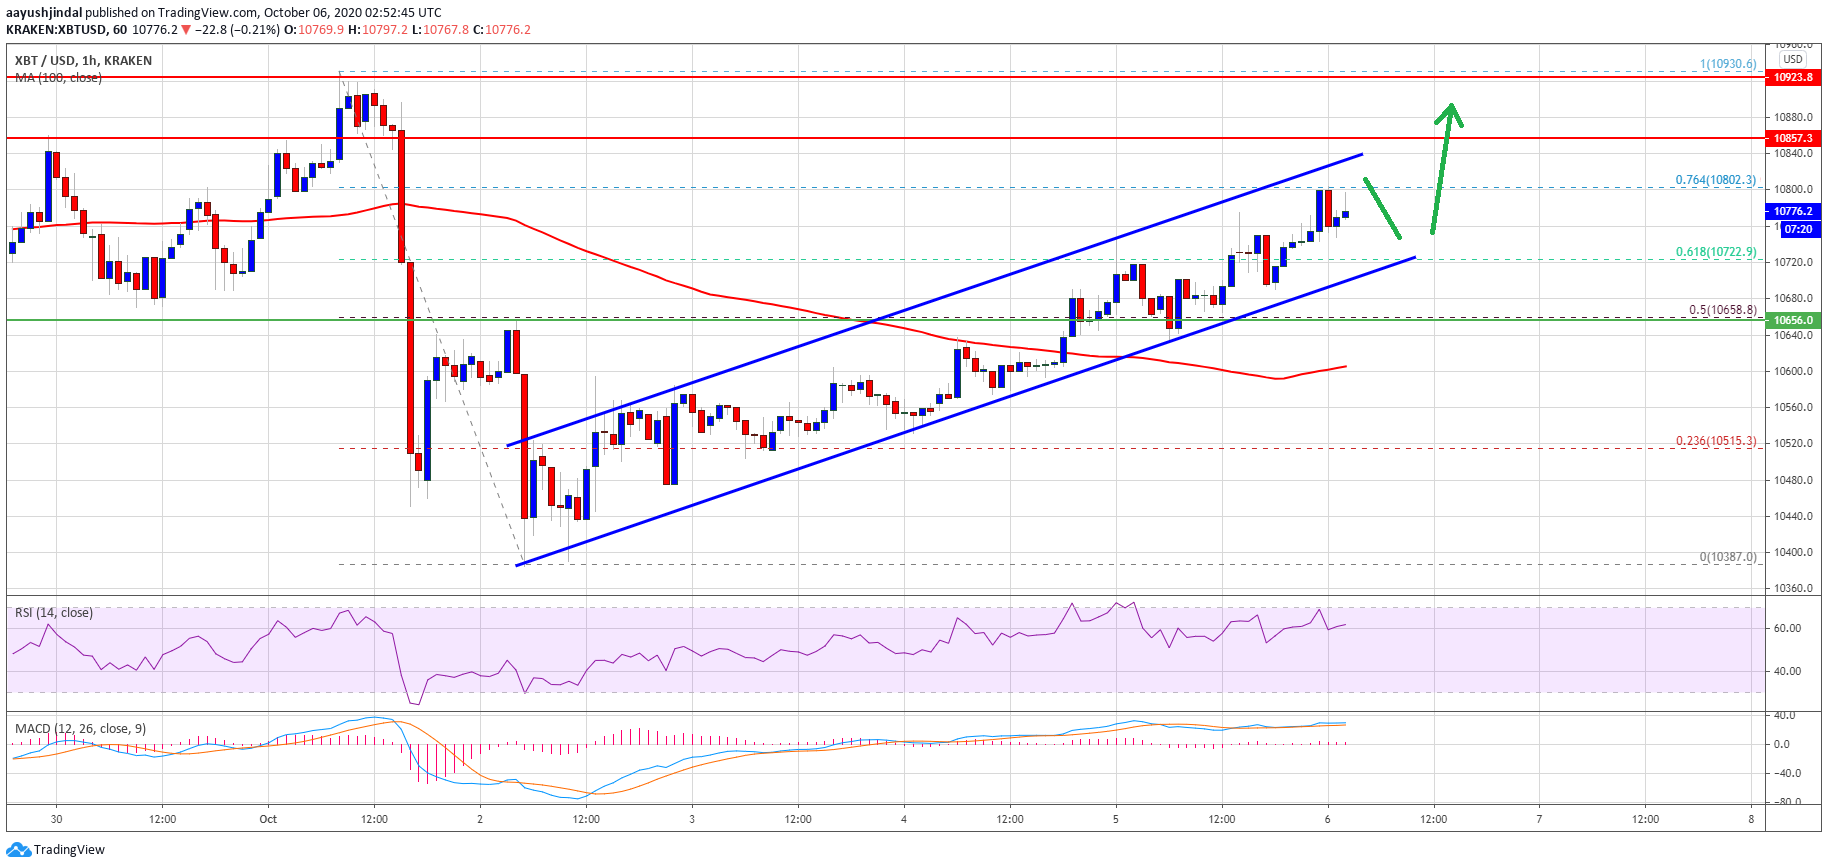
Bitcoin price climbs above $10,750. Source: TradingView.com
The price is now approaching a couple of major hurdles near $10,850, $10,920 and $11,000. A successful daily close above the $11,000 resistance level is needed to start a strong upward move.
The next key resistance is near the $11,200 level, above which the bulls are likely to aim a test of the $11,500 level in the near term.
Another Rejection in BTC?
If bitcoin fails to continue higher above the $10,850 resistance or the $10,920 hurdle, there is a risk of another bearish reaction. An initial support on the downside is the channel trend line at $10,720.
A break below the channel support could lead the price towards the $10,650 support. The next major support is near the $10,600 level since it is close to the 100 hourly simple moving average.
Technical indicators:
Hourly MACD – The MACD is currently struggling to gain momentum in the bullish zone.
Hourly RSI (Relative Strength Index) – The RSI for BTC/USD is currently flat near the 60 level.
Major Support Levels – $10,720, followed by $10,650.
Major Resistance Levels – $10,800, $10,850 and $10,920.