
Reason to trust
How Our News is Made
Strict editorial policy that focuses on accuracy, relevance, and impartiality
Ad discliamer
Morbi pretium leo et nisl aliquam mollis. Quisque arcu lorem, ultricies quis pellentesque nec, ullamcorper eu odio.
Bitcoin price tested the $47,000 support zone before starting a recovery against the US Dollar. BTC is showing positive signs, but it might face hurdles near $53,500.
- Bitcoin is rising and it is trading nicely above the $50,000 pivot level.
- The price is now trading well above $51,000 and the 100 hourly simple moving average.
- There was a break above a major bearish trend line with resistance near $51,500 on the hourly chart of the BTC/USD pair (data feed from Kraken).
- The pair is likely to rally if there is a clear break above the $53,500 resistance zone.
Bitcoin Price is Recovering
Bitcoin declined again below the $48,500 support level. BTC even spiked below the $47,500 low and it traded to a new swing low near $47,000.
The bulls appeared near the $47,000 zone and the price started a steady recovery. There was a break above the $50,000 resistance level. The price climbed above the 61.8% Fib retracement level of the last key drop from the $51,050 high to $47,000 swing low.
There was a break above a major bearish trend line with resistance near $51,500 on the hourly chart of the BTC/USD pair. The pair is now trading well above $51,000 and the 100 hourly simple moving average.
The current price action is positive and the price is now trading nicely above $52,000. On the upside, there is a major resistance waiting near the $53,200 and $53,500 levels. The 1.618 Fib extension level of the last key drop from the $51,050 high to $47,000 swing low is also near $53,500.
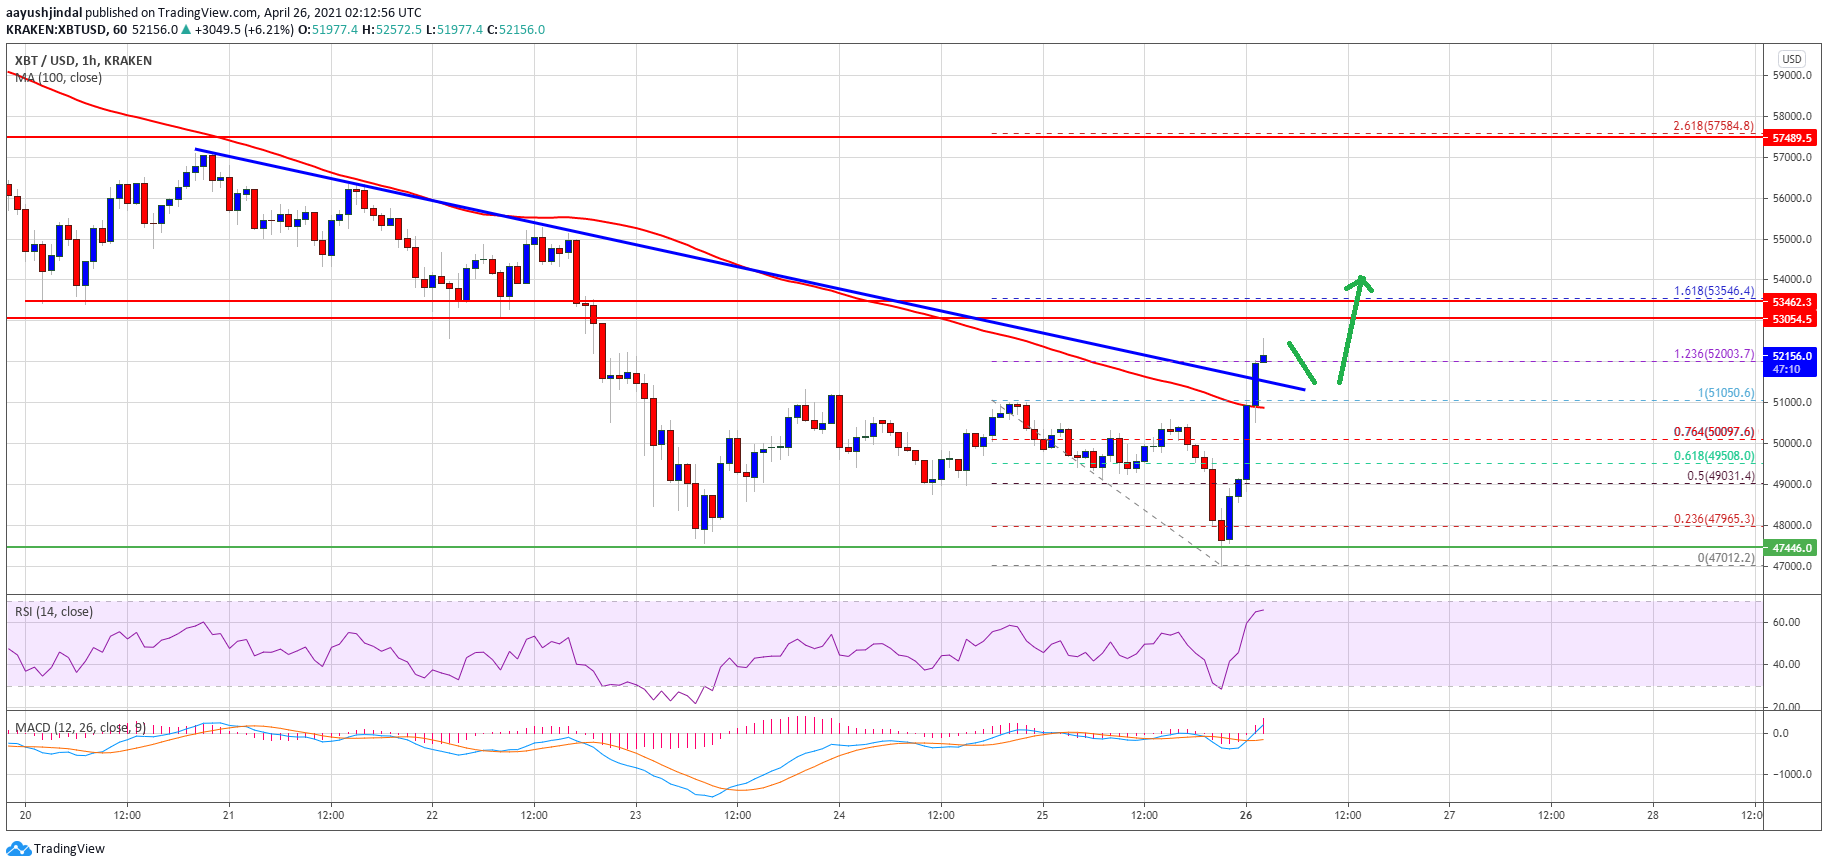
Source: BTCUSD on TradingView.com
A successful break and close above the $53,500 level could spark a strong upward move. In the stated case, the price is likely to rally above the $54,500 and $55,000 levels in the near term.
Dips Limited in BTC?
If bitcoin fails to clear the $53,200 and $53,500 resistance levels, it could start a downside correction. An immediate support on the downside is near the $51,500 level.
The first key support is near the $51,000 level and the 100 hourly simple moving average. A fresh close below the 100 hourly simple moving average is likely to open the doors for a drop towards the $48,500 support.
Technical indicators:
Hourly MACD – The MACD is slowly gaining strength in the bullish zone.
Hourly RSI (Relative Strength Index) – The RSI for BTC/USD is now well above the 50 level.
Major Support Levels – $51,500, followed by $51,000.
Major Resistance Levels – $53,200, $53,500 and $55,000.