
Reason to trust
How Our News is Made
Strict editorial policy that focuses on accuracy, relevance, and impartiality
Ad discliamer
Morbi pretium leo et nisl aliquam mollis. Quisque arcu lorem, ultricies quis pellentesque nec, ullamcorper eu odio.
Bitcoin is currently correcting higher from the $6,559 swing low against the US Dollar. BTC price is now testing the 100 hourly SMA and it is likely to struggle near $6,960-$7,000.
- Bitcoin is slowly recovering higher after trading as low as $6,559 against the US Dollar.
- The bulls were able to push the price above the $6,750 and $6,800 level.
- There is a major bearish trend line forming with resistance near $7,100 on the hourly chart of the BTC/USD pair (data feed from Kraken).
- The pair is likely to struggle near the 100 hourly simple moving average and $6,960.
Bitcoin Facing Hurdles
Yesterday, we saw a sharp decline in bitcoin price below the $6,800 level against the US Dollar. BTC price even traded below the $6,700 level and formed a new monthly low at $6,559.
It is currently correcting higher and trading above the $6,800 level. There was a break above the 23.6% Fib retracement level of the key drop from the $7,220 swing high to $6,559 low.
Bitcoin is now trading near a major resistance at $6,900 and the 100 hourly simple moving average. The 50% Fib retracement level of the key drop from the $7,220 swing high to $6,559 low is also acting as a strong resistance near the $6,888 level.
If the bulls manage to surpass the 100 hourly SMA, the price is likely to face hurdles near the $6,950 and $7,000 levels. There is also a major bearish trend line forming with resistance near $7,100 on the hourly chart of the BTC/USD pair.
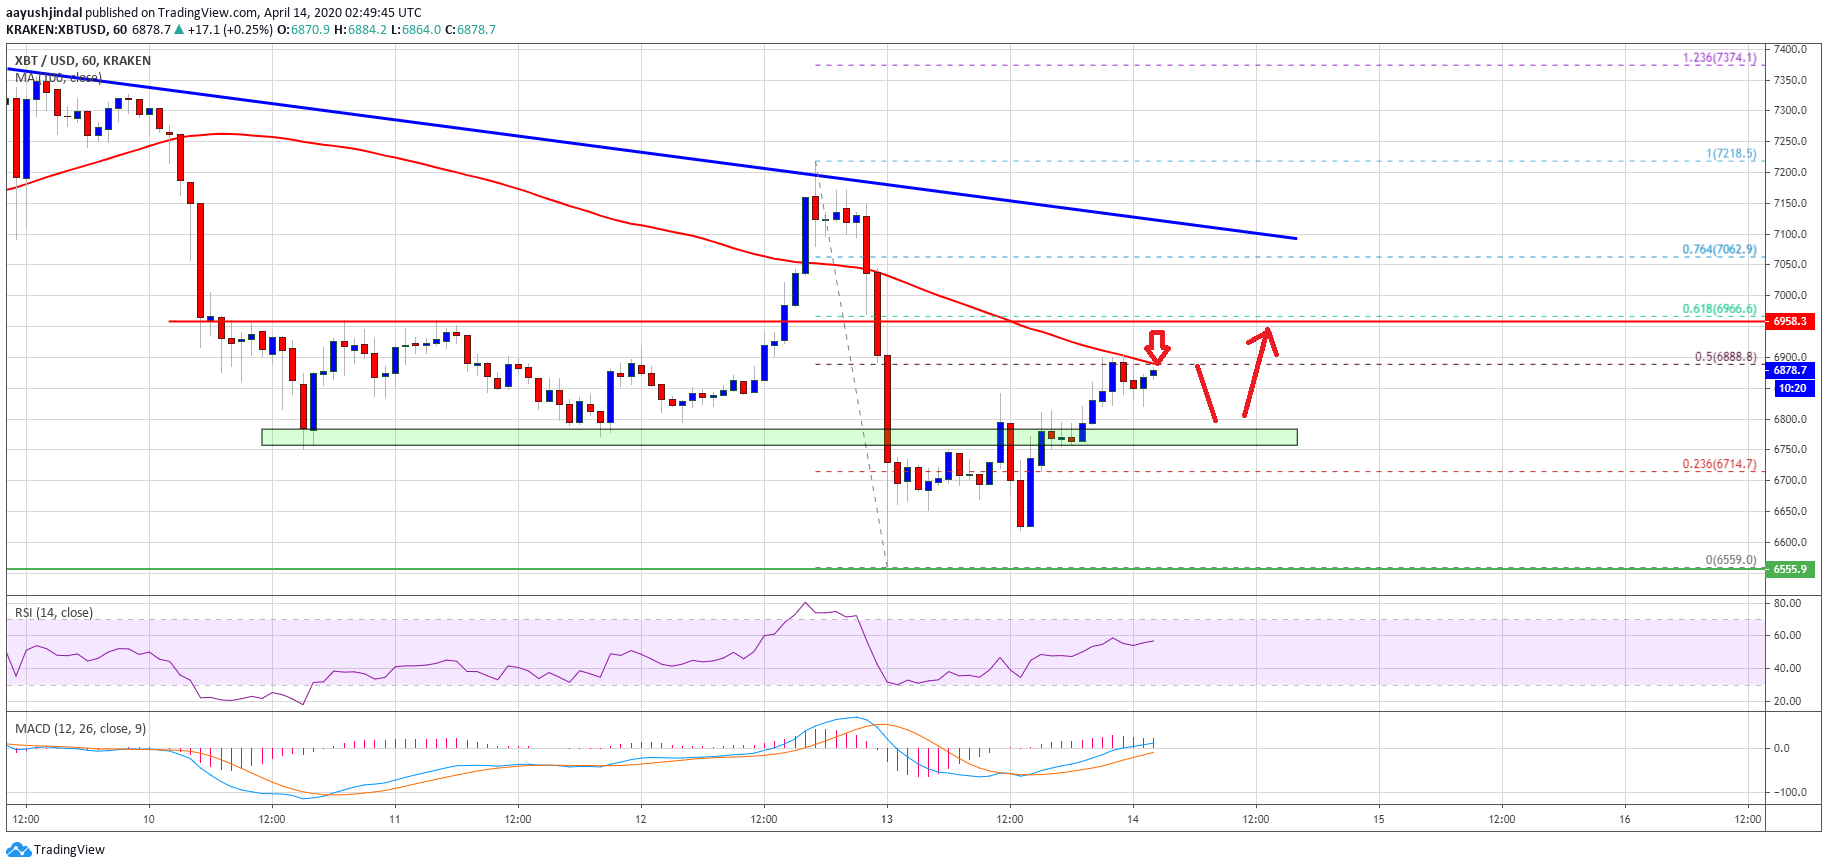
Therefore, the price is clearly facing a lot of hurdles, starting with $6,900 and up to $7,100. To move into a positive zone, the bulls need to gain momentum above the $7,000 resistance and then settle above $7,100. The next key hurdle on the upside is near the $7,500 level.
Fresh Decline?
If bitcoin fails to continue above the $6,900 resistance or the 100 hourly SMA, it could start a fresh decline. On the downside, an initial support is near the $6,750 area.
A successful break below the $6,700 support area could start a major decline. The next support is near the $6,560 level, below which the bears are likely to aim a test of the $6,200 support level in the near term.
Technical indicators:
Hourly MACD – The MACD is currently struggling to gain pace in the bullish zone.
Hourly RSI (Relative Strength Index) – The RSI for BTC/USD is now just above the 50 level.
Major Support Levels – $6,750 followed by $6,560.
Major Resistance Levels – $6,900, $6,950 and $7,100.


