
Reason to trust
How Our News is Made
Strict editorial policy that focuses on accuracy, relevance, and impartiality
Ad discliamer
Morbi pretium leo et nisl aliquam mollis. Quisque arcu lorem, ultricies quis pellentesque nec, ullamcorper eu odio.
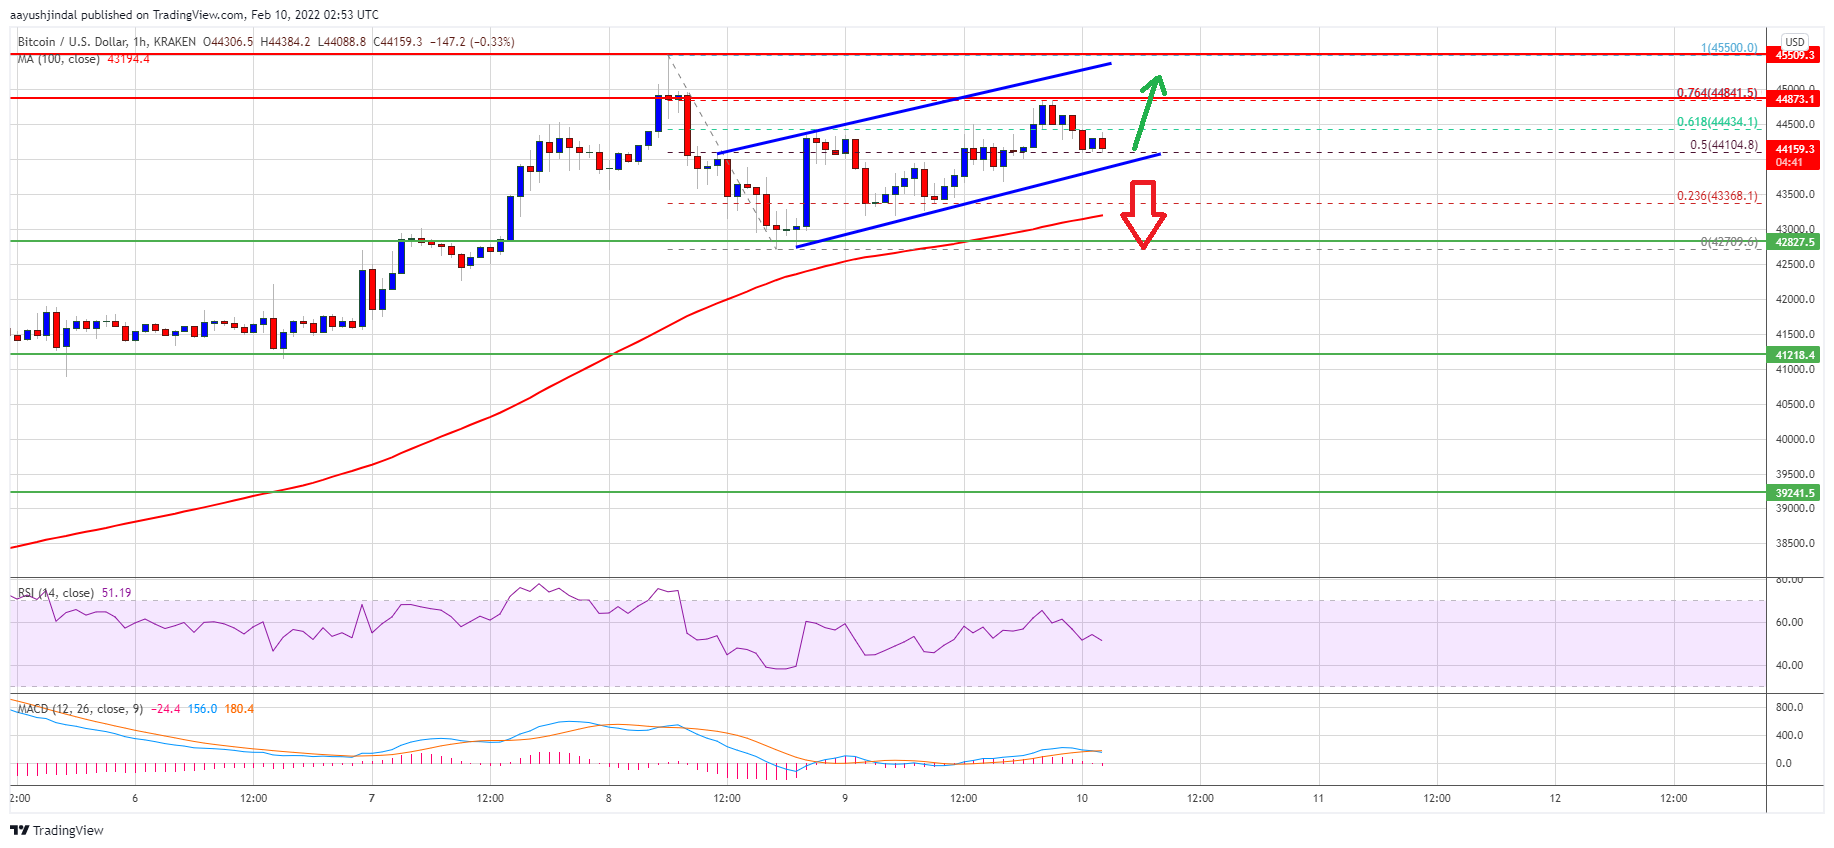
Bitcoin remained well supported near the $42,700 support zone against the US Dollar. BTC is rising and might accelerate higher above $44,850 in the near term.
- Bitcoin is holding gains, but it is still well below the $45,000 resistance zone.
- The price is trading above $43,000 and the 100 hourly simple moving average.
- There is a key rising channel forming with support near $44,000 on the hourly chart of the BTC/USD pair (data feed from Kraken).
- The pair could decline sharply if there is a clear move below the 100 hourly SMA.
Bitcoin Price Aims Fresh Increase
Bitcoin price started a downside correction below the $44,000 level. BTC even declined below the $43,000 level, but the bulls appeared near the $42,700 zone.
The price also remained stable above $42,500 and the 100 hourly simple moving average. A low was formed near $42,709 and the price started a fresh increase. There was a clear move above the $43,200 and $43,500 resistance levels.
Besides, the price climbed above the 50% Fib retracement level of the downward move from the $45,500 swing high to $42,709 low.
There is also a key rising channel forming with support near $44,000 on the hourly chart of the BTC/USD pair. Bitcoin price is now trading above $42,000 and the 100 hourly simple moving average. On the upside, an immediate resistance is near the $44,500 level.
Source: BTCUSD on TradingView.com
The next major resistance is near the $44,850 zone or the 76.4% Fib retracement level of the downward move from the $45,500 swing high to $42,709 low, above which the price may perhaps rally above $45,000. In the stated case, the price could continue to rise towards the $46,500 level.
Downside Break in BTC?
If bitcoin fails to start a fresh increase above $44,850, it could continue to move down. An immediate support on the downside is near the $44,000 zone.
The next major support is seen near the $43,500 level and the 100 hourly simple moving average. If there is a downside break below the $43,500 support, the price could start a major decline towards the $41,200 level.
Technical indicators:
Hourly MACD – The MACD is slowly moving into the bearish zone.
Hourly RSI (Relative Strength Index) – The RSI for BTC/USD is now near the 50 level.
Major Support Levels – $44,000, followed by $43,500.
Major Resistance Levels – $44,850, $45,000 and $45,500.


