
Reason to trust
How Our News is Made
Strict editorial policy that focuses on accuracy, relevance, and impartiality
Ad discliamer
Morbi pretium leo et nisl aliquam mollis. Quisque arcu lorem, ultricies quis pellentesque nec, ullamcorper eu odio.
Bitcoin price is currently recovering and trading above $11,500 against the US Dollar. BTC is likely to accelerate higher once it clears the $11,700 resistance and the 100 hourly SMA.
- Bitcoin is showing a few positive signs and trading above the $11,500 level.
- The price is testing a major resistance near $11,700 and the 100 hourly simple moving average.
- There is a major bearish trend line forming with resistance near $11,690 on the hourly chart of the BTC/USD pair (data feed from Kraken).
- The pair must settle above the $11,800 level to move into a positive zone in the near term.
Bitcoin Price is Recovering
Bitcoin price formed a decent support base above the $11,350 level and recently started a recovery wave against the US Dollar. BTC broke a couple of key hurdles near the $11,500 and $11,600 levels.
There was also a break above the 50% Fib retracement level of the downward move from the $11,900 swing high to $11,350 swing low. The price is now trading above $11,650, but it is facing a major resistance near $11,700 and the 100 hourly simple moving average.
There is also a major bearish trend line forming with resistance near $11,690 on the hourly chart of the BTC/USD pair. The trend line is close to the 61.8% Fib retracement level of the downward move from the $11,900 swing high to $11,350 swing low.
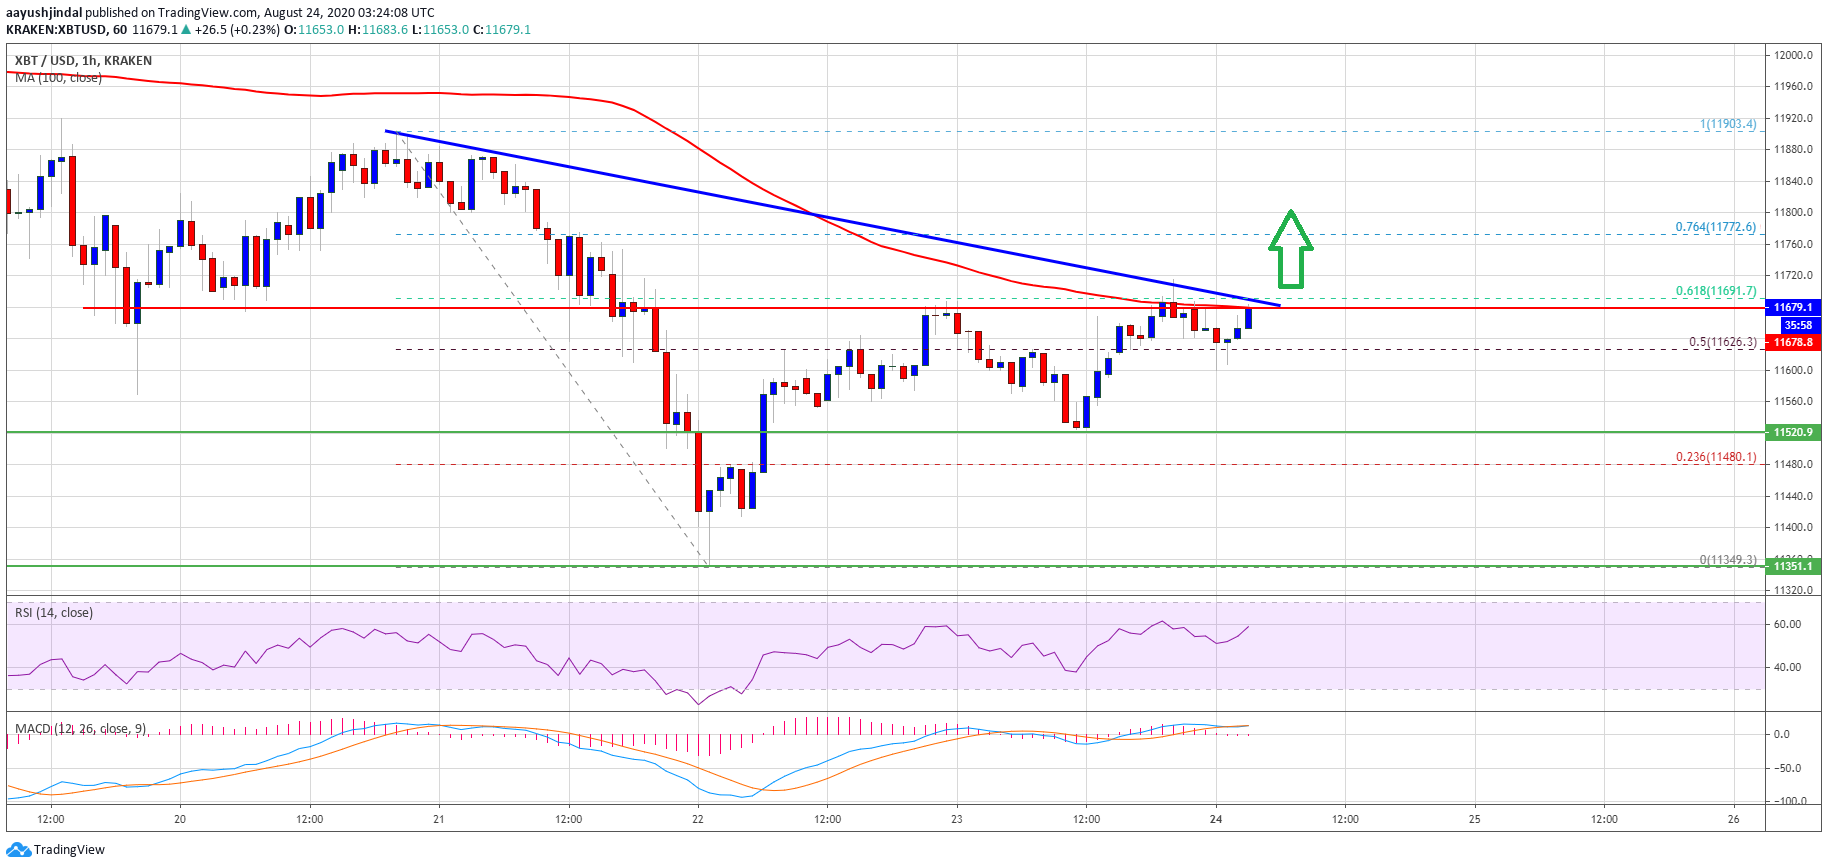
Bitcoin price trades above $11,650. Source: TradingView.com
A successful break above the trend line resistance, $11,700, and the 100 hourly SMA could lead the price towards the $11,800 resistance. A successful close above the $11,800 level might lead the price towards the $12,000 barrier in the coming sessions.
In the mentioned bullish case, the bulls are likely to gain strength and there are chances of a drift towards the $12,500 level.
Fresh Rejection in BTC?
If bitcoin fails to continue higher above the 100 hourly SMA or the $11,700 resistance, there could be a fresh rejection and a bearish reaction.
An initial support on the downside is near the $11,600 level. The first major support is near the $11,520 level, below which the price might dive towards the $11,350 support level in the near term.
Technical indicators:
Hourly MACD – The MACD is slowly losing momentum in the bullish zone.
Hourly RSI (Relative Strength Index) – The RSI for BTC/USD is now well above the 50 level, with a bullish angle.
Major Support Levels – $11,600, followed by $11,520.
Major Resistance Levels – $11,700, $11,800 and $12,000.


