
Reason to trust
How Our News is Made
Strict editorial policy that focuses on accuracy, relevance, and impartiality
Ad discliamer
Morbi pretium leo et nisl aliquam mollis. Quisque arcu lorem, ultricies quis pellentesque nec, ullamcorper eu odio.
Bitcoin price is showing recovering signs above $32,000 against the US Dollar. BTC is facing an uphill task at $34,000 and it is likely to continue lower towards $30,000.
- Bitcoin is correcting higher from $28,865 and it is trading above the $32,000 resistance.
- The price is facing a strong resistance near $34,000 and the 100 simple moving average (4-hours).
- There is a short-term contracting triangle forming with resistance near $33,000 on the 4-hours chart of the BTC/USD pair (data feed from Kraken).
- The pair could face a strong resistance near the $33,800 and $34,000 levels in the near term.
Bitcoin Price Remains At Risk
This past week, bitcoin price saw a sharp decline below the $35,000 and $34,000 support levels against the US Dollar. The BTC/USD pair even tumbled below the $30,000 support and settled well below the 100 simple moving average (4-hours).
A low was formed near $28,800 before the price started an upside correction. It broke the $30,000 level and it even recovered above the $31,500 level.
There was also a test of the 50% Fib retracement level of the downward move from the $37,847 swing high to $28,867 low. There is also a short-term contracting triangle forming with resistance near $33,000 on the 4-hours chart of the BTC/USD pair.
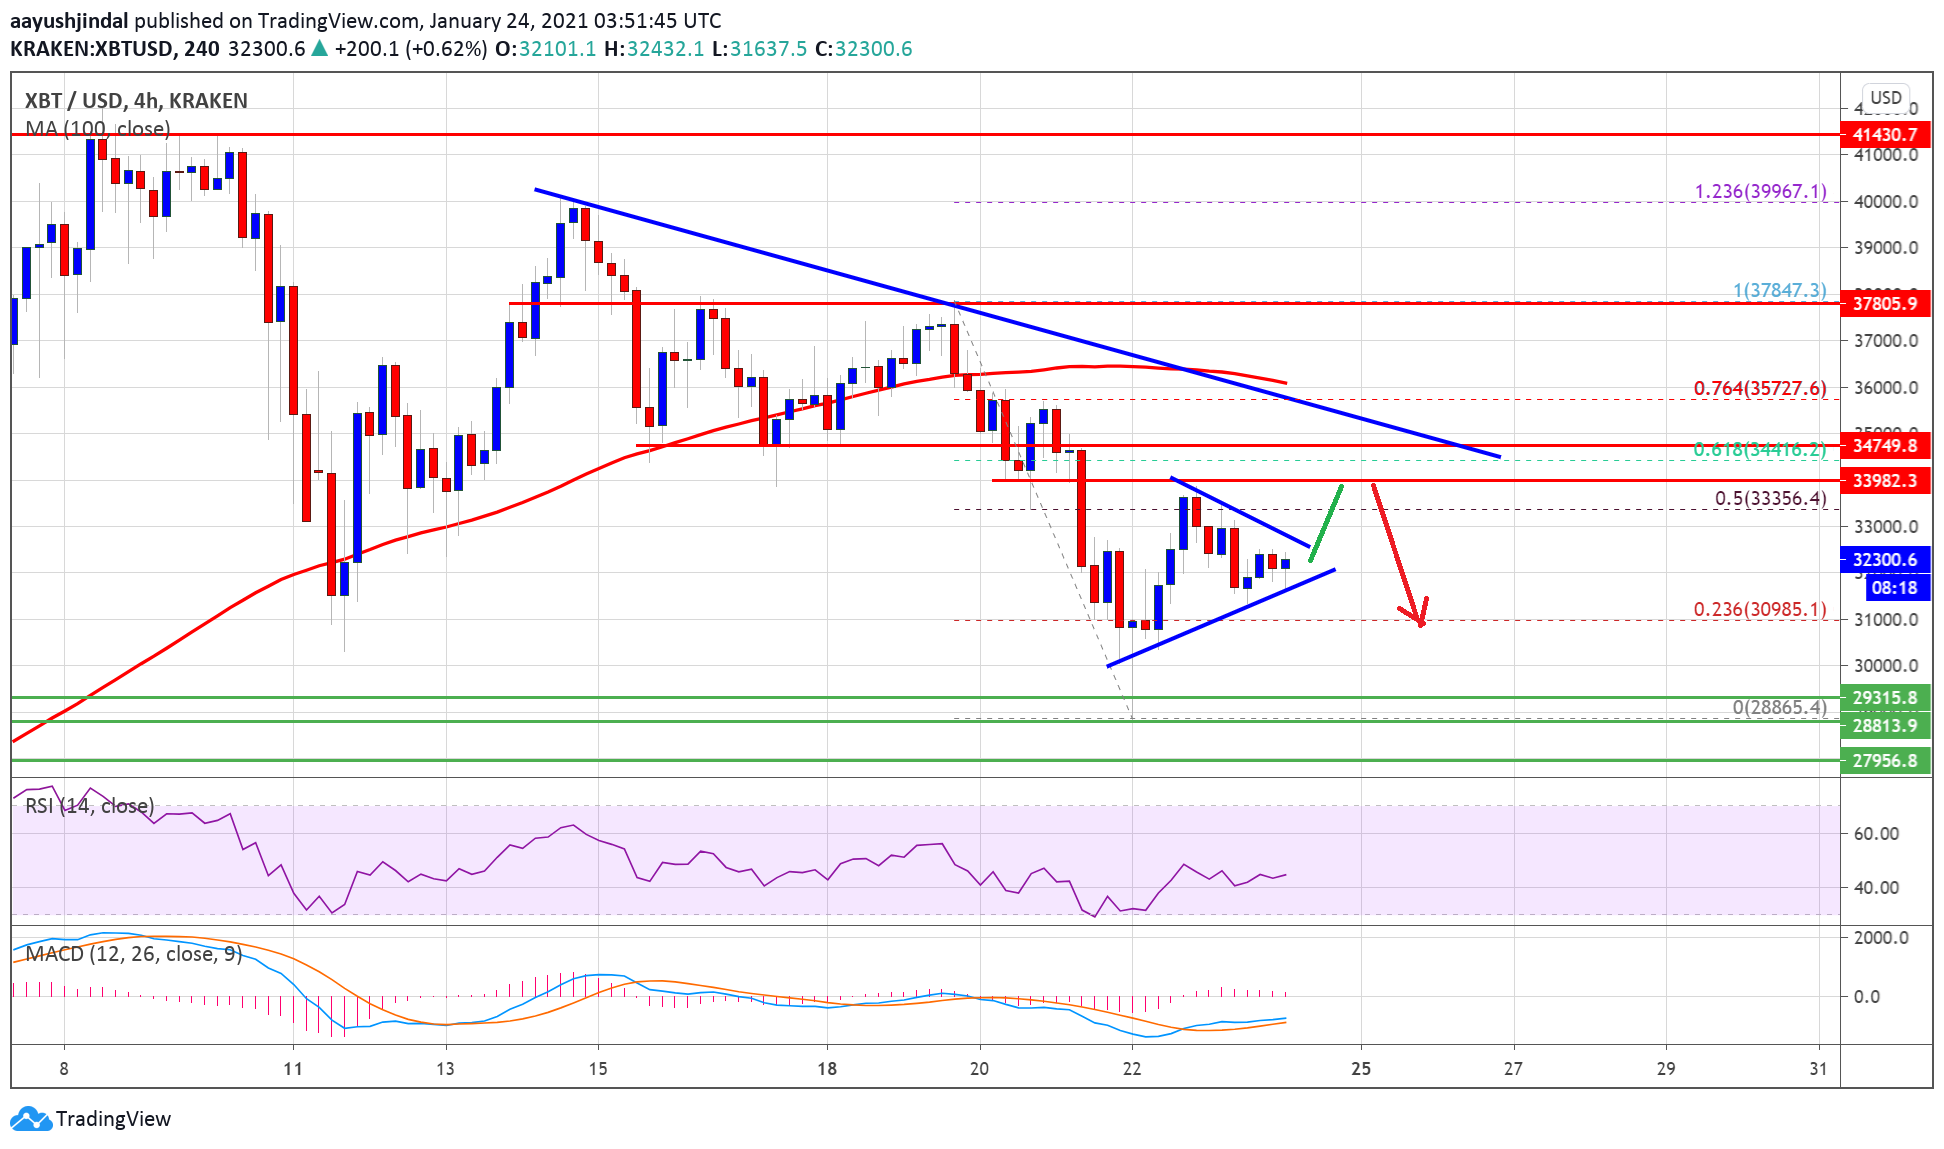
Source: BTCUSD on TradingView.com
If there is a triangle break, the price could face hurdles near the $33,800 and $34,000 levels. There is also a key bearish trend line forming near $34,500 on the same chart. It is close to the 61.8% Fib retracement level of the downward move from the $37,847 swing high to $28,867 low.
A close above the $34,000 and $34,500 resistance levels could open the doors for a larger increase. The next major hurdle is near the $38,000 level.
Fresh Drop in BTC?
If bitcoin fails to clear the $33,500 and $34,000 resistance levels, there is a risk of another decline. An initial support on the downside is near the $31,800 level.
A clear break below the $31,800 and $31,500 support levels could clear the path for a push towards the $30,000 support zone in the near term. Any more losses might call for a test of $28,800.
Technical indicators
4 hours MACD – The MACD for BTC/USD is slowly gaining momentum in the bullish zone.
4 hours RSI (Relative Strength Index) – The RSI for BTC/USD is rising towards the 50 level.
Major Support Level – $30,000
Major Resistance Level – $34,000