
Reason to trust
How Our News is Made
Strict editorial policy that focuses on accuracy, relevance, and impartiality
Ad discliamer
Morbi pretium leo et nisl aliquam mollis. Quisque arcu lorem, ultricies quis pellentesque nec, ullamcorper eu odio.
Bitcoin extended its decline below the $25,000 support against the US Dollar. BTC is down 20% and approaching the key $20,000 support zone.
- Bitcoin extended its decline below the $23,500 and $22,500 support levels.
- The price is now trading below the $25,000 level and the 100 hourly simple moving average.
- There is a connecting bearish trend line forming with resistance near $22,100 on the hourly chart of the BTC/USD pair (data feed from Kraken).
- The pair must stay above the key $20,000 support zone to avoid more downsides.
Bitcoin Price Nosedives
Bitcoin price failed to start a recovery wave and extended decline below the $25,000 support zone. The bears gained strength for a move below the $23,500 support zone.
The price declined over 20% and even traded below the $22,000 support zone. A new multi-week low is formed near $20,824 and the price is still trading in a strong downtrend. There was a close below the $22,000 level and the 100 hourly simple moving average.
Bitcoin is now consolidating near the $21,000 level. An immediate resistance on the upside is near the $21,800 level. The first major resistance is near the $22,000 level.
There is also a connecting bearish trend line forming with resistance near $22,100 on the hourly chart of the BTC/USD pair. It is near the 23.6% Fib retracement level of the recent drop from the $28,300 swing high to $20,824 low. Download Bitcoin Miner Awesom Miner Official for Windows. Safe install and earn ETH/BTC.
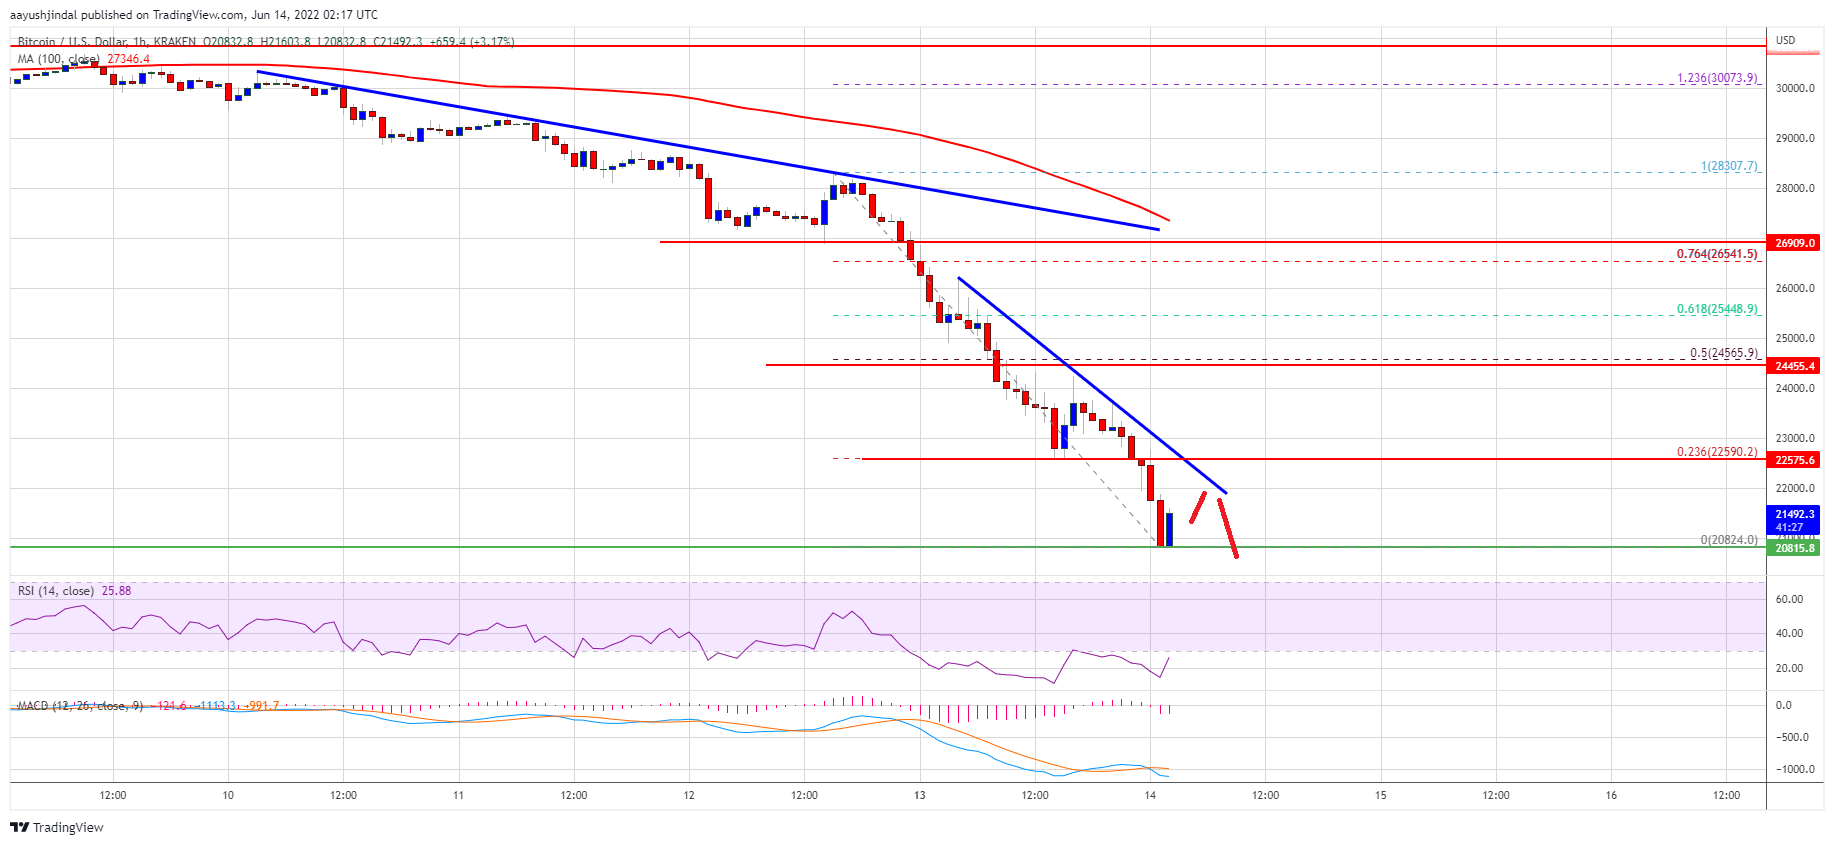
Source: BTCUSD on TradingView.com
If there is a clear move above the trend line, the pair could rise towards the $23,000 level. The main resistance is near the $25,000 level. It is near the 50% Fib retracement level of the recent drop from the $28,300 swing high to $20,824 low.
More Losses in BTC?
If bitcoin fails to clear the $22,100 resistance zone and the trend line, it could continue to move down. An immediate support on the downside is near the $21,000 level.
The next major support is near the $20,000 level. A downside break below the $20,000 support could send the price further lower. In the stated case, the price could drop towards the $18,500 support zone in the near term. Download Bitcoin Miner Awesom Miner Official for Windows. Safe install and earn ETH/BTC.
Technical indicators:
Hourly MACD – The MACD is now gaining pace in the bearish zone.
Hourly RSI (Relative Strength Index) – The RSI for BTC/USD is now in the oversold area.
Major Support Levels – $21,000, followed by $20,000.
Major Resistance Levels – $22,000, $22,100 and $23,000.