
Reason to trust
How Our News is Made
Strict editorial policy that focuses on accuracy, relevance, and impartiality
Ad discliamer
Morbi pretium leo et nisl aliquam mollis. Quisque arcu lorem, ultricies quis pellentesque nec, ullamcorper eu odio.
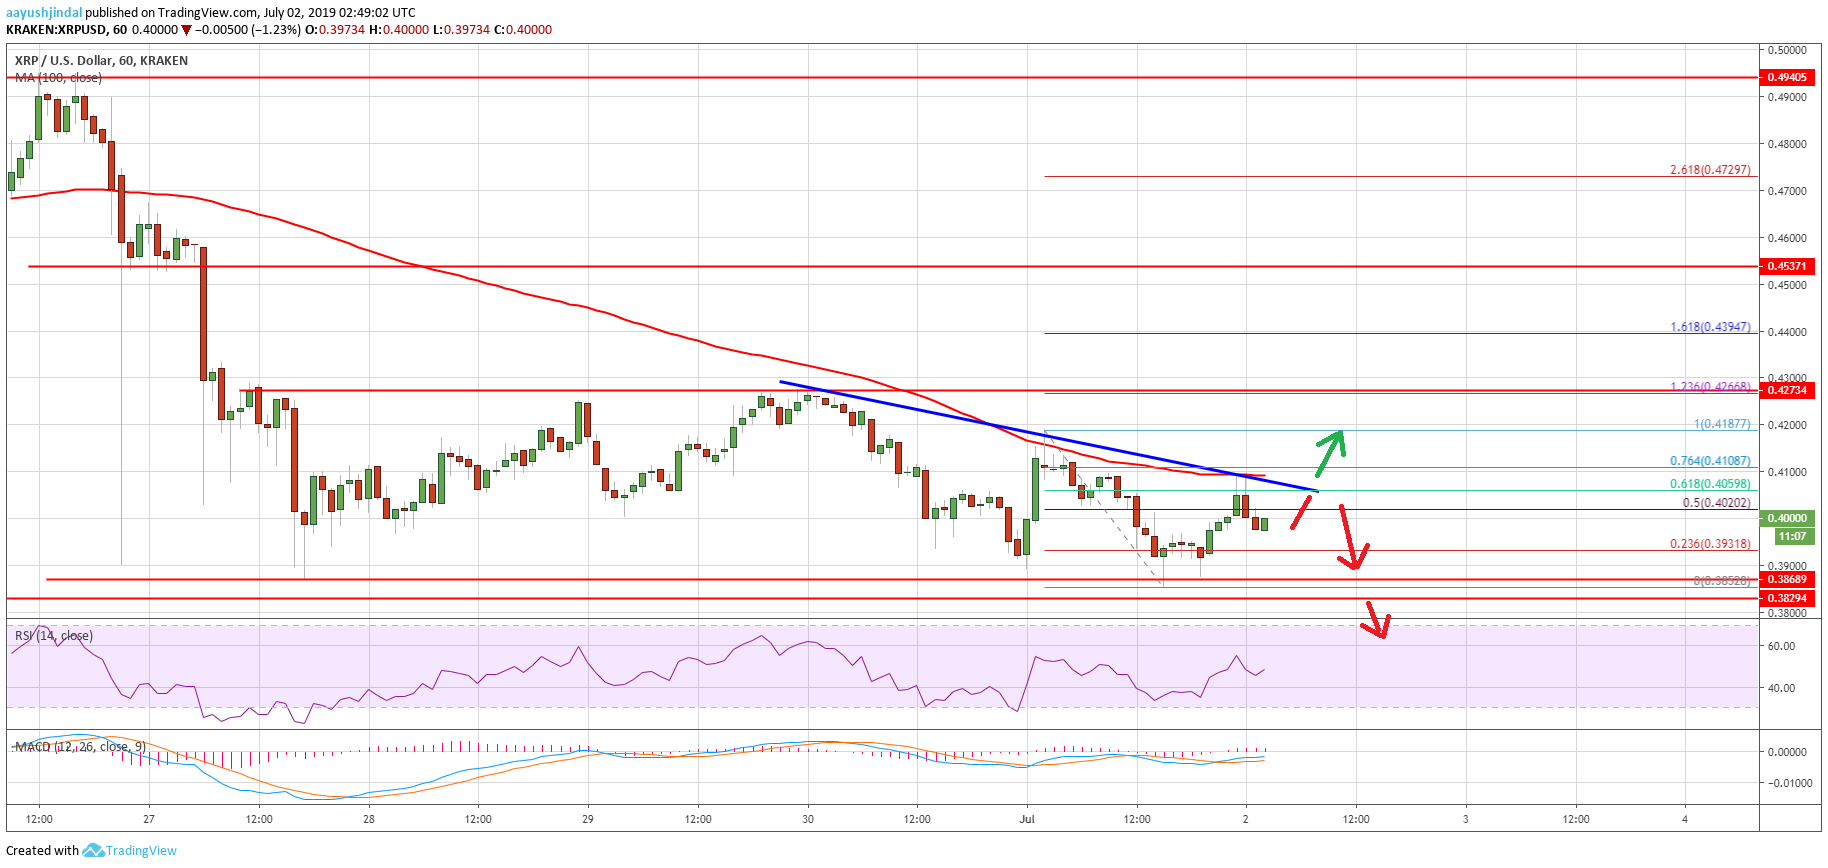
- Ripple price remains in a bearish zone and it recently retested the $0.3840 support against the US dollar.
- The price is struggling to stay above the $0.3840 support and it could slide further.
- There is a major bearish trend line forming with resistance near $0.4050 on the hourly chart of the XRP/USD pair (data source from Kraken).
- Ethereum price settled below $300 and it could decline further below the $275 support area.
Ripple price is struggling to hold a couple of important supports against the US Dollar, while bitcoin declined 7%. XRP price might decline heavily if it breaks $0.3800.
Ripple Price Analysis
Recently, bitcoin price extended losses below the $10,500 and $10,000 levels, but ripple price stayed above the $0.3840 support against the US Dollar. Earlier, the XRP/USD pair made an attempt to recover above the $0.4150 and $0.4185 resistance levels. However, the price failed to gain pace above the $0.4185 level. Moreover, there was no upside break above the $0.4185 level plus the 100 hourly simple moving average.
As a result, the price declined again below the $0.4150 and $0.4100 levels. It even broke the $0.4000 support and retested the main $0.3840-$0.3850 support area. At the moment, ripple is correcting higher above $0.3920. There was a break above the 50% Fib retracement level of the last decline from the $0.4187 high to $0.3852 low. However, the price is facing a lot of hurdles near the $0.4100 level and the 100 hourly SMA.
Moreover, there is a major bearish trend line forming with resistance near $0.4050 on the hourly chart of the XRP/USD pair. The 61.8% Fib retracement level of the last decline from the $0.4187 high to $0.3852 low is also acting as a strong resistance. Therefore, a successful close above the trend line and $0.4150 is needed for a fresh increase in the near term.
If there is no upside break above the $0.4150 and $0.4185 resistances, the price could extend losses. On the downside, the main supports are near $0.3850 and $0.3840. If there is a downside break, the price might start an extended decline below the $0.3800 support.
Looking at the chart, ripple price is clearly struggling to recover above $0.4100 and $0.4150. If it continues to face hurdles, there is a risk of a downside break below $0.3840 and $0.3800. The next major support below $0.3840 is near the $0.2720 level.
Technical Indicators
Hourly MACD – The MACD for XRP/USD is struggling to gain pace in the bullish zone.
Hourly RSI (Relative Strength Index) – The RSI for XRP/USD is currently attempting to climb above 50.
Major Support Levels – $0.3920, $0.3850 and $0.3840.
Major Resistance Levels – $0.4100, $0.4150 and $0.4185.