
Reason to trust
How Our News is Made
Strict editorial policy that focuses on accuracy, relevance, and impartiality
Ad discliamer
Morbi pretium leo et nisl aliquam mollis. Quisque arcu lorem, ultricies quis pellentesque nec, ullamcorper eu odio.
Bitcoin is rising steadily and it recently broke the $9,400 resistance against the US Dollar. BTC’s daily chart suggests that the bulls are likely aiming a larger rally towards $10,000.
- Bitcoin formed a strong support base near $9,000 and recently started a fresh increase.
- The price is currently trading well above the $9,200 support and the 100-day simple moving average.
- There was a break above a crucial bearish trend line with resistance near $9,350 on the daily chart of the BTC/USD pair (data feed from Kraken).
- The pair could correct lower, but it seems like the bulls are likely to aim a test of $9,800 or $10,000.
Bitcoin Price Could Rally To $10,000
After a minor decline below the $9,000 level, bitcoin price found support at $8,800 against the US Dollar. BTC remained well bid above the $8,800 level and the 100-day simple moving average.
As a result, a fresh increase was initiated and the price broke a few important hurdles near $9,000, $9,300 and $9,400 (as discussed in yesterday’s analysis). There was a break above the 23.6% Fib retracement level of the key downward move from the $10,376 swing high to $8,802 low.
More importantly, there was a break above a crucial bearish trend line with resistance near $9,350 on the daily chart of the BTC/USD pair. This is a positive sign and suggests that the bulls are taking control above $9,300.
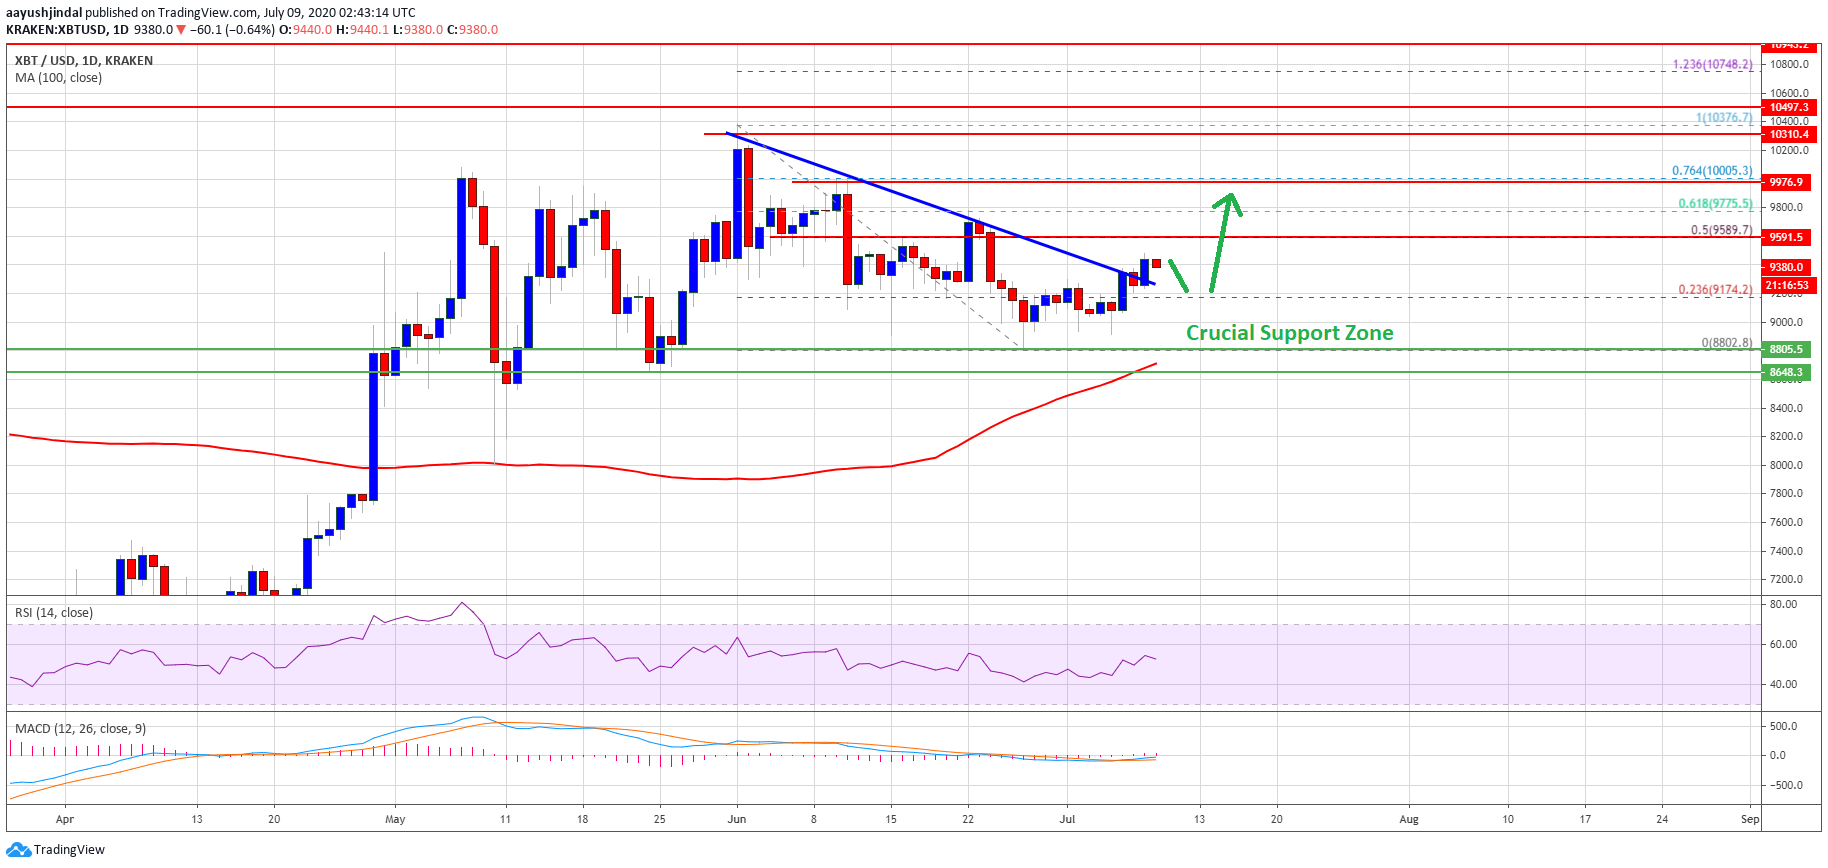
Bitcoin price breaks $9,400: Source: TradingView.com
An initial resistance on the upside is near $9,580 and $9,600. It is close to the 50% Fib retracement level of the key downward move from the $10,376 swing high to $8,802 low. A successful break above the $9,600 level could open the doors for a larger upward move towards the $10,000 resistance in the coming days.
Chances of Downside Correction?
In the short-term, bitcoin might correct lower towards the broken bearish trend line at $9,320 or $9,300. If there is a bearish break below the $9,300 level, the price might find support near $9,200.
Any further losses may perhaps push the price towards the $8,800 support or the 100-day simple moving average, which holds the key for a larger breakdown. A close below $8,800 and $8,650 might start a strong decline towards $8,000 or $7,800 in the near term.
Technical indicators:
Daily MACD – The MACD is currently gaining momentum in the bullish zone.
Daily RSI (Relative Strength Index) – The RSI for BTC/USD is now above the 50 level.
Major Support Levels – $9,300 followed by $8,800.
Major Resistance Levels – $9,580, $10,000 and $10,300.