
Reason to trust
How Our News is Made
Strict editorial policy that focuses on accuracy, relevance, and impartiality
Ad discliamer
Morbi pretium leo et nisl aliquam mollis. Quisque arcu lorem, ultricies quis pellentesque nec, ullamcorper eu odio.
Bitcoin price gained nearly 5% and it tested the $12,500 resistance against the US Dollar. BTC is currently correcting gains, but technicals suggest more upsides above $12,500.
- Bitcoin broke the main $12,000 resistance area to start a strong upward move.
- The price traded close to the $12,500 resistance and it is currently correcting gains.
- There is a key bullish flag pattern forming with resistance near $12,380 on the hourly chart of the BTC/USD pair (data feed from Kraken).
- The pair could start a fresh rally if it clears the $12,380 and $12,400 resistance levels.
Bitcoin Price Breaks Key Resistance
Yesterday, we saw positive moves in bitcoin and discussed chances of an upside break above $12,000 against the US Dollar. BTC did gain momentum and surpassed the $11,850 resistance.
It opened the doors for an upside break above the $12,000 resistance level. The price broke the $12,200 resistance and settled well above the 100 hourly simple moving average. It traded close to the $12,500 resistance and it is currently correcting gains.
A new monthly high is formed near $12,479 and the price is now trading below $12,400. Bitcoin is testing the 23.6% Fib retracement level of the recent rally from the $11,785 swing low to $12,479 high.
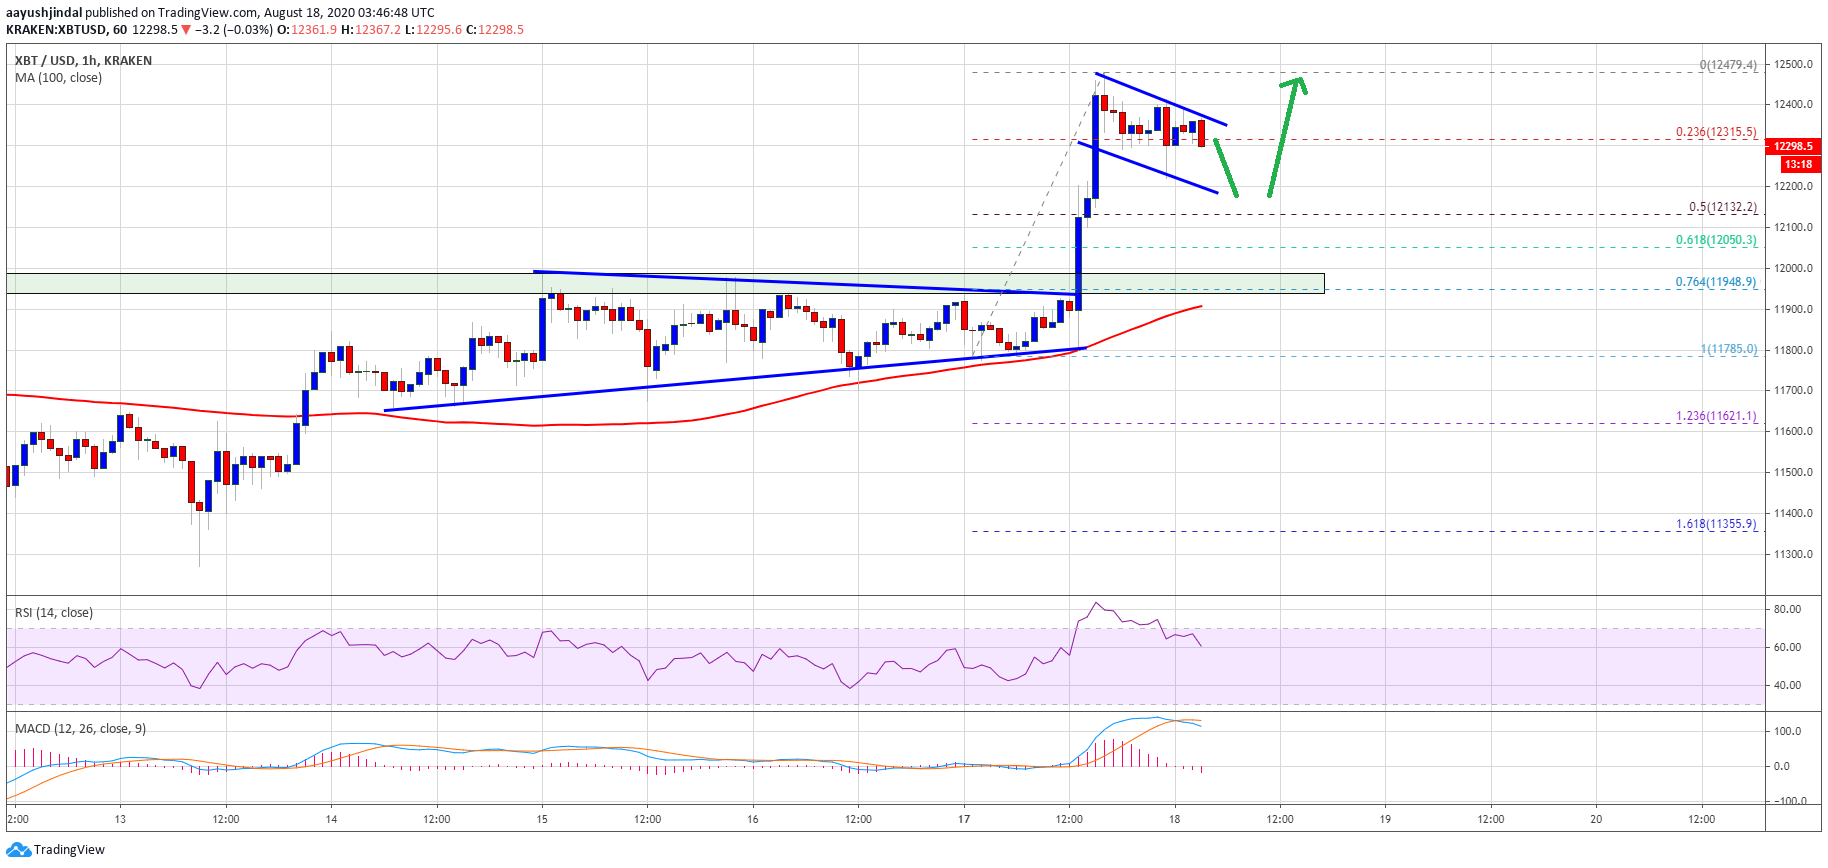
Bitcoin price trades above $12,200. Source: TradingView.com
It seems like there is a key bullish flag pattern forming with resistance near $12,380 on the hourly chart of the BTC/USD pair. The main support is now forming near the $12,120 level or the 50% Fib retracement level of the recent rally from the $11,785 swing low to $12,479 high.
On the upside, the price could start a fresh rally if it clears the flag resistance and the $12,400 level. An immediate resistance is near the $12,500 level. A successful close above the $12,500 level might open the doors for a sharp rise towards the $13,000 level in the near term.
Dips Supported in BTC?
If bitcoin fails to clear the $12,400 resistance, there might be a downside correction. The first major hurdle for the bears is seen near the $12,100 level.
The key support and a possible buy zone could be near the $12,000 level (the recent breakout zone), below which the price might decline towards the $11,900 level or the 100 hourly SMA.
Technical indicators:
Hourly MACD – The MACD is slowly losing pace in the bullish zone.
Hourly RSI (Relative Strength Index) – The RSI for BTC/USD is currently correcting lower towards the 50 level.
Major Support Levels – $12,120, followed by $12,000.
Major Resistance Levels – $12,380, $12,400 and $12,500.