
Reason to trust
How Our News is Made
Strict editorial policy that focuses on accuracy, relevance, and impartiality
Ad discliamer
Morbi pretium leo et nisl aliquam mollis. Quisque arcu lorem, ultricies quis pellentesque nec, ullamcorper eu odio.
Bitcoin price is slowly recovering above $32,000 against the US Dollar. BTC is likely to face a strong selling interest near $33,500 and $34,000.
- Bitcoin seems to be consolidating above the $31,000 and $32,000 support levels.
- The price is currently just above $32,500 and the 100 hourly simple moving average.
- There was a break above a declining channel with resistance near $32,650 on the hourly chart of the BTC/USD pair (data feed from Kraken).
- The pair is likely to continue higher towards the $33,500 and $34,000 resistance levels.
Bitcoin Price Stuck Below $33.5K
After forming a base above the $30,000 level, bitcoin price corrected higher. BTC managed to clear the $31,200 and $31,500 resistance levels to move into a short-term positive zone.
There was a break above the 23.6% Fib retracement level of the downward move from the $37,892 high to $28,809 low. It is now trading just above $32,500 and the 100 hourly simple moving average. There was also a break above a declining channel with resistance near $32,650 on the hourly chart of the BTC/USD pair.
Bitcoin price is approaching the $33,000 resistance level. The next key resistance could be near $33,500 or the 50% Fib retracement level of the downward move from the $37,892 high to $28,809 low.
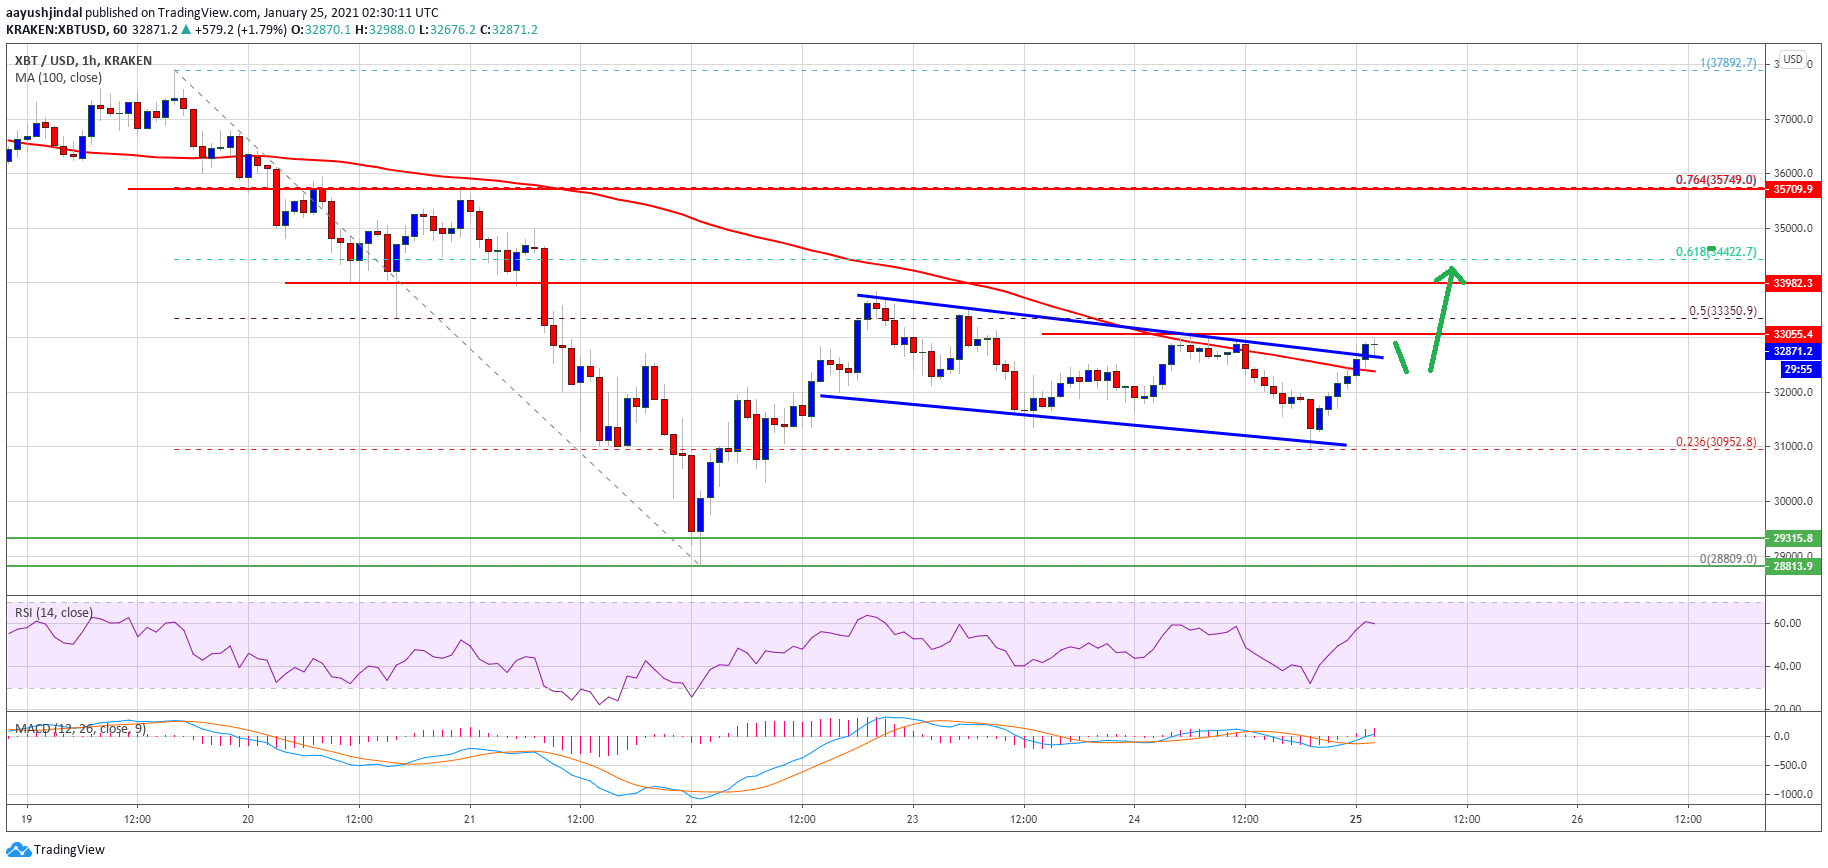
Source: BTCUSD on TradingView.com
Any further gains could lead the price towards the $34,000 resistance zone. To move into a positive zone and start a steady increase, the bulls need to gain strength above $34,000 and $34,500 in the near term. The next major resistance is near the $35,800 level, where the bulls might take a stand.
Fresh Decline in BTC?
If bitcoin fails to recover above $33,500 and $34,000, there is a risk of another decline. An initial support on the downside is near the $32,000 level.
The first major support is near the $31,250 and $31,200 levels. A downside break below $31,200 and a follow up move below $31,000 may possibly start a strong decline towards $28,500 in the coming sessions. It seems like the price might consolidate in a range below the $34,000 resistance level before it makes the next major move.
Technical indicators:
Hourly MACD – The MACD is slowly gaining momentum in the bullish zone.
Hourly RSI (Relative Strength Index) – The RSI for BTC/USD is now recovering towards the 40 level.
Major Support Levels – $30,000, followed by $28,800.
Major Resistance Levels – $30,800, $31,000 and $32,800.


