
Reason to trust
How Our News is Made
Strict editorial policy that focuses on accuracy, relevance, and impartiality
Ad discliamer
Morbi pretium leo et nisl aliquam mollis. Quisque arcu lorem, ultricies quis pellentesque nec, ullamcorper eu odio.
Bitcoin is holding the $9,120 and $9,200 support levels against the US Dollar. However, BTC is facing a confluence of resistance near $9,400, above which it could start a strong rally.
- Bitcoin is slowly rising and trading above the $9,200 support zone.
- The price is trading well below the $9,400 resistance, but above the 100 hourly simple moving average.
- There are two bearish trend lines forming with resistance near $9,320 and $9,380 on the hourly chart of the BTC/USD pair (data feed from Kraken).
- The pair must settle above both trend lines and $9,400 to start a strong upward move.
Bitcoin Price is Facing Hurdles
In the past few sessions, bitcoin consolidated above the $9,120 and $9,160 support levels against the US Dollar. The recent swing low was formed near $9,161 before BTC climbed higher.
It broke the $9,200 level and the 100 hourly simple moving average. The bulls pushed the price above the $9,300 level, but there was a lack in the bullish momentum. A high is formed near $9,331 and the price is currently correcting lower.
Bitcoin broke the 23.6% Fib retracement level of the recent wave from the $9,161 low to $9,331 high. It seems like there are two bearish trend lines forming with resistance near $9,320 and $9,380 on the hourly chart of the BTC/USD pair.
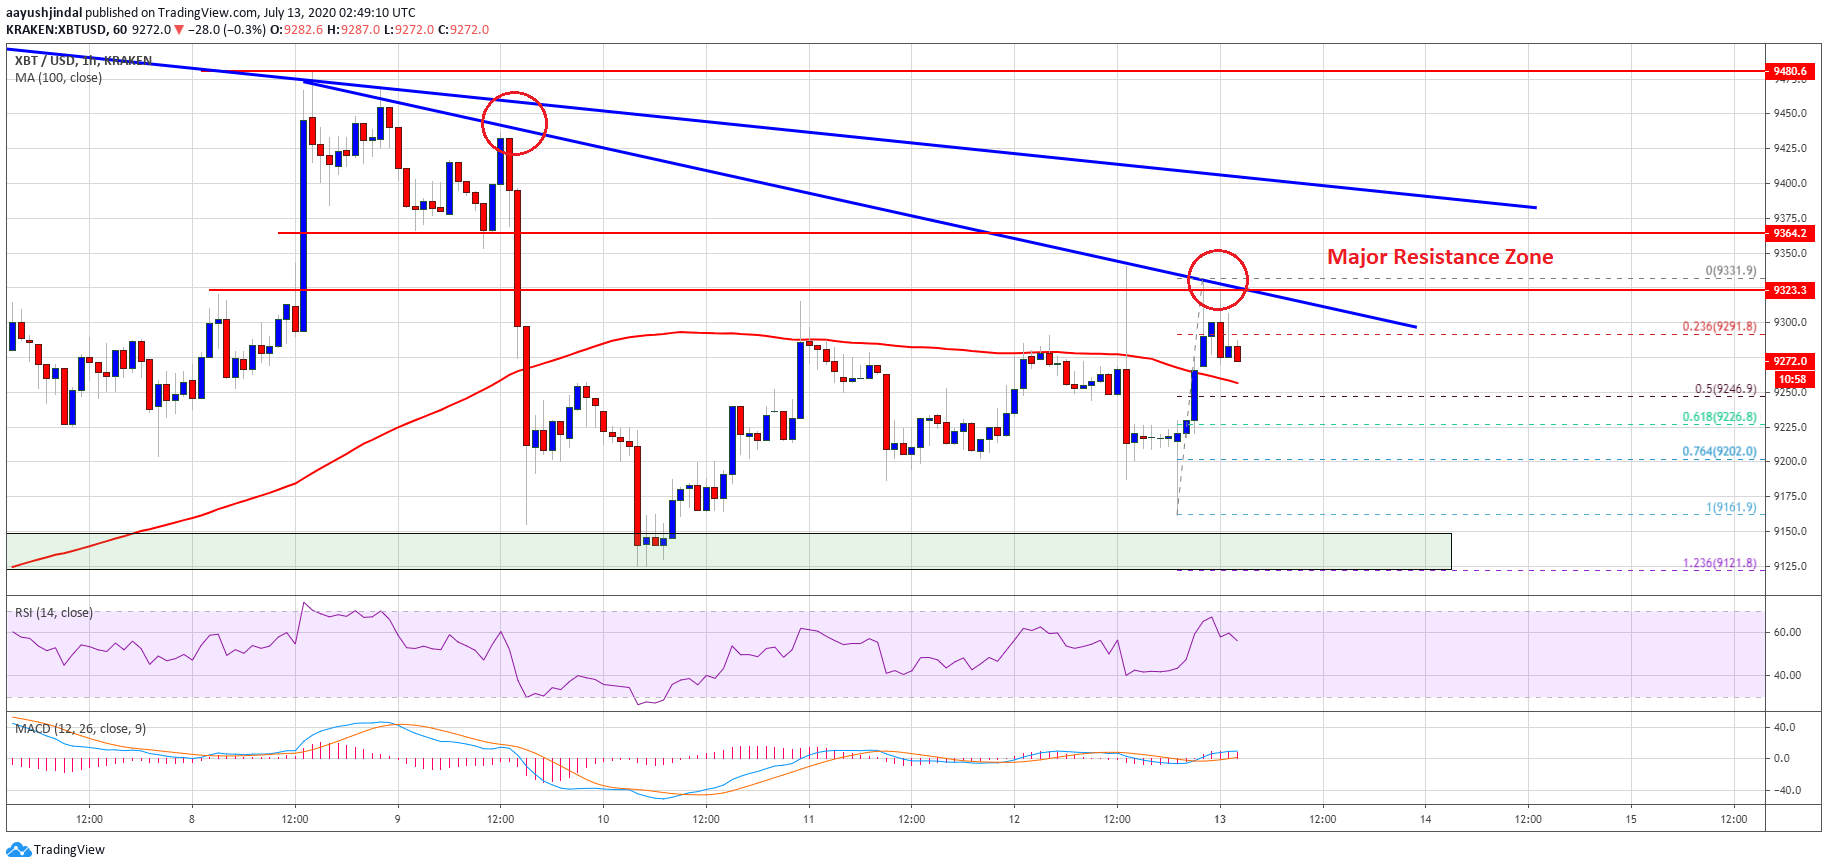
Bitcoin price testing $9,300: Source: TradingView.com
There are many important hurdles forming for the bulls, starting with $9,320 and up to $9,400. Therefore, it won’t be easy for them to gain strength. If they succeed in clearing both trend lines and $9,400, there are chances of a sustained upward move.
In the mentioned case, there are high chances of an upside break above the $9,500 resistance level. The next key hurdles are near the $9,600 and $9,800 levels.
Fresh Drop in BTC
The first major support is near the $9,250 level, the 100 hourly SMA, and the 50% Fib retracement level of the recent wave from the $9,161 low to $9,331 high.
If bitcoin fails to stay above the $9,250 support, it could continue to move down towards the $9,200 support. The main uptrend support is still near the $9,120 level, below which the bears are likely to take control in the coming sessions (as discussed in the weekly analysis).
Technical indicators:
Hourly MACD – The MACD is slowly moving in the bullish zone.
Hourly RSI (Relative Strength Index) – The RSI for BTC/USD is currently well above the 50 level.
Major Support Levels – $9,200, followed by $9,120.
Major Resistance Levels – $9,320, $9,380 and $9,400.