
Reason to trust
How Our News is Made
Strict editorial policy that focuses on accuracy, relevance, and impartiality
Ad discliamer
Morbi pretium leo et nisl aliquam mollis. Quisque arcu lorem, ultricies quis pellentesque nec, ullamcorper eu odio.
Bitcoin is attempting an upside correction above $57,000 against the US Dollar. BTC could gain pace if there is a close above the $58,000 resistance.
- Bitcoin is facing resistance near the $58,000 and $58,500 levels.
- The price is now trading near $57,500 and the 100 hourly simple moving average.
- There was a break above a major bearish trend line with resistance near $57,100 on the hourly chart of the BTC/USD pair (data feed from Kraken).
- The pair must settle above $58,000 to start a fresh increase in the near term.
Bitcoin Price is Still Struggling
Bitcoin price remained in a range above the $55,500 support zone. BTC formed a base above the $55,500 level and is currently attempting a decent recovery wave.
There was a break above the $56,500 and $57,000 resistance levels. Besides, there was a break above a major bearish trend line with resistance near $57,100 on the hourly chart of the BTC/USD pair. The pair even spiked above the $57,500 level and the 100 hourly simple moving average.
However, the price is still struggling to gain pace above the $58,000 level. A high is formed near $58,222 and the price is now consolidating gains.
The bears pushed the price below the 23.6% Fib retracement level of the upward move from the $55,909 swing low to $58,222 high. An immediate support is near the $57,500 level. The first major support is now forming near the $57,000 level.
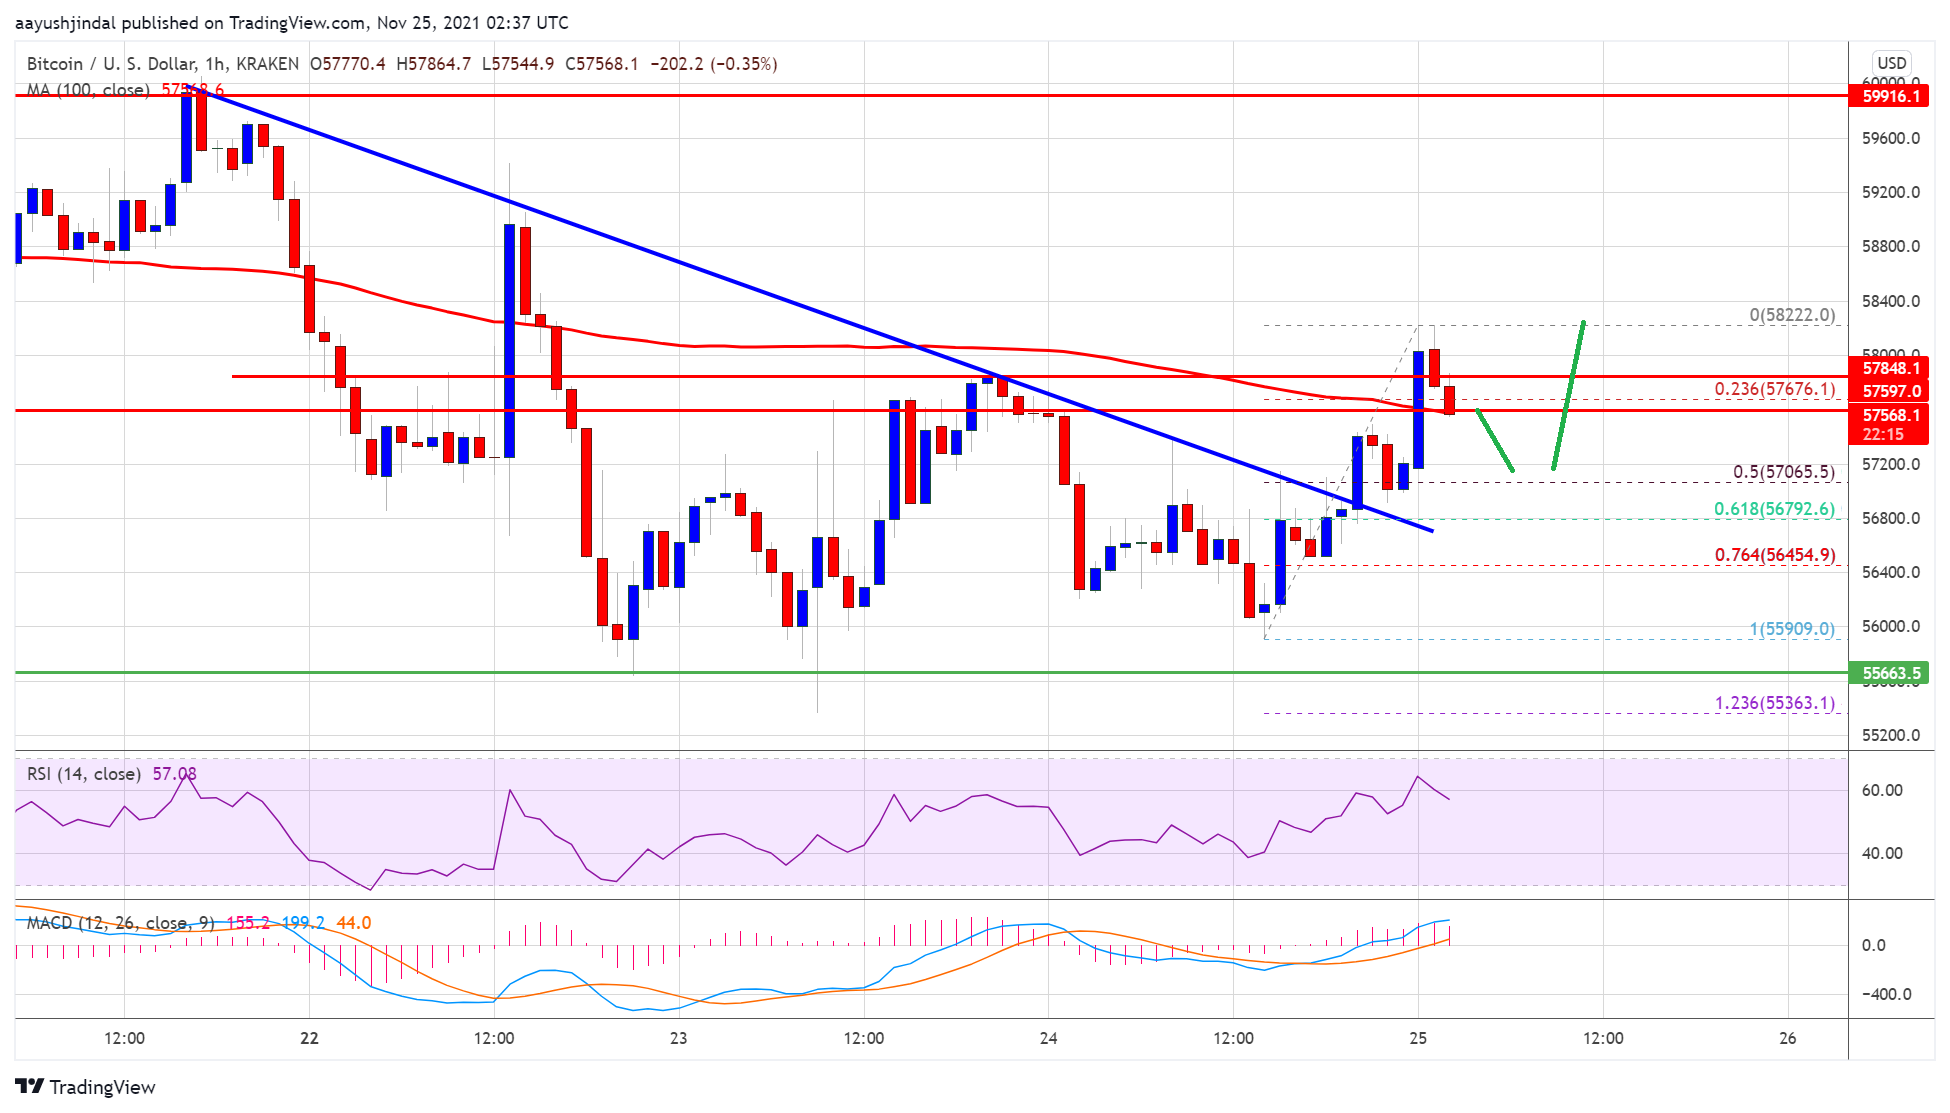
Source: BTCUSD on TradingView.com
The 50% Fib retracement level of the upward move from the $55,909 swing low to $58,222 high is also near $57,000. The next major support is near the $56,500 level, below which the price could resume its decline towards the main breakdown support at $55,500.
Upside Capped In BTC?
If bitcoin stays above the $56,500 support, it could continue to rise. On the upside, an initial resistance is near the $58,000 level.
The next key resistance is near the $58,500 level. A close above the $58,000 and $58,500 levels may possibly start a steady increase in the near term. The next major resistance sits near the $60,000 level.
Technical indicators:
Hourly MACD – The MACD is now losing pace in the bearish zone.
Hourly RSI (Relative Strength Index) – The RSI for BTC/USD is well above the 50 level.
Major Support Levels – $56,500, followed by $56,000.
Major Resistance Levels – $58,000, $58,500 and $60,000.


