
Reason to trust
How Our News is Made
Strict editorial policy that focuses on accuracy, relevance, and impartiality
Ad discliamer
Morbi pretium leo et nisl aliquam mollis. Quisque arcu lorem, ultricies quis pellentesque nec, ullamcorper eu odio.
Bitcoin cash price is up more than 8% and it broke the key $250 resistance. BCH seems to be outpacing BTC and it could even climb towards $275 or $300 in the near term.
- Bitcoin cash price is gaining bullish momentum and it recently broke the $250 resistance against the US Dollar.
- The price is now trading well above the $255 level and the 100 SMA (4-hours).
- There is a major bullish trend line forming with support near $246 on the 4-hours chart of the BCH/USD pair (data feed from Kraken).
- The pair is likely to accelerate higher towards the $275 high or even $300.
Bitcoin Cash Price Could Revisit $300
Recently, there was a strong increase in bitcoin price above the $10,000 resistance. It sparked a major surge in bitcoin cash price above the $240 and $250 resistance levels.
A strong support base was formed above $235 and the 100 simple moving average (4-hours). The recent surge was such that the price even broke the $255 pivot level.
BCH is now testing the 1.236 Fib extension level of the last key decline from the $255 swing high to $220 low. There is also a major bullish trend line forming with support near $246 on the 4-hours chart of the BCH/USD pair.
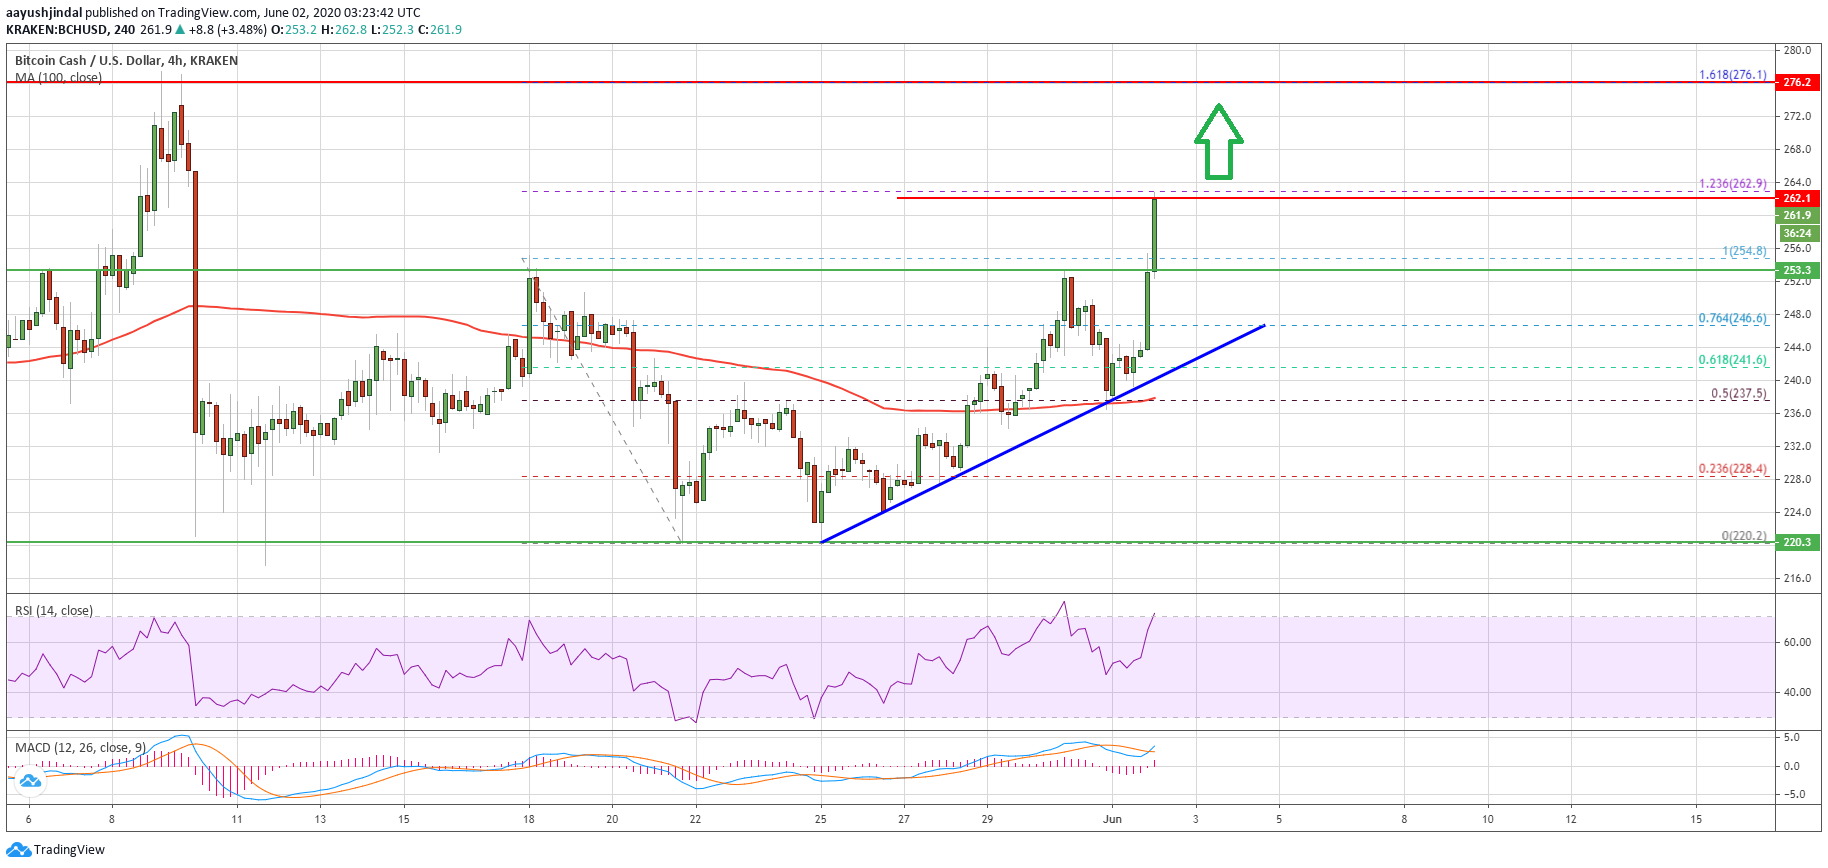
The current price action is very bullish, suggesting more gains in the near term above $265. An immediate resistance is near the $270 level. The first major resistance is near the $275 zone (the last key resistance). It is also close to the 1.618 Fib extension level of the last key decline from the $255 swing high to $220 low.
If bitcoin cash surges above the $270 and $275 resistance levels, the bulls are likely to aim a test of the $300 resistance zone. An intermediate resistance could be near the $288 level.
Dips Supported in BCH
In the short term, there could be a minor pullback in bitcoin cash from $262 or $265. On the downside, the first support is seen near the $255 level (the recent breakout zone).
The main support is now forming near the trend line and $245. Any further losses may perhaps lead the price towards the $235 support and the 100 simple moving average (4-hours).
Technical indicators
Hourly MACD – The MACD for BCH/USD is currently gaining pace in the bullish zone.
Hourly RSI (Relative Strength Index) – The RSI for BCH/USD is now well above the 60 level, with a bullish angle.
Key Support Levels – $255 and $245.
Key Resistance Levels – $275 and $300.


