
Reason to trust
How Our News is Made
Strict editorial policy that focuses on accuracy, relevance, and impartiality
Ad discliamer
Morbi pretium leo et nisl aliquam mollis. Quisque arcu lorem, ultricies quis pellentesque nec, ullamcorper eu odio.
Key Points
- Bitcoin cash price is moving lower from the $2960 swing high against the US Dollar.
- There was a break below a major bullish trend line with support at $2840 on the hourly chart of BCH/USD (data feed from Kraken).
- The pair might continue to decline and it will most likely retest the $2500 support area.
Bitcoin cash price is trading lower from $3000 against the US Dollar. BCH/USD might decline further towards the $2500 and $2400 support levels.
Bitcoin Cash Price Resistance
There was a decent upside move in bitcoin cash price above the $2600 level against the US Dollar. The price traded towards the $3000 level, but there was no test of the stated level. A high was formed near $2960 and the price started a downside correction. It traded below the $2800 support. There was also a break below a major bullish trend line with support at $2840 on the hourly chart of BCH/USD.
The pair traded below the $2600 support and formed a low at $2543. Later, an upside wave was initiated and the price moved above the $2600 level. It also moved above the 23.6% Fib retracement level of the last decline from the $2960 high to $2543 low. However, the upside wave was protected by the $2750 resistance level. Moreover, the 38.2% Fib retracement level of the last decline from the $2960 high to $2543 low also acted as a resistance. On the upside, there is also a bearish trend line on the same chart with current resistance at $2750.
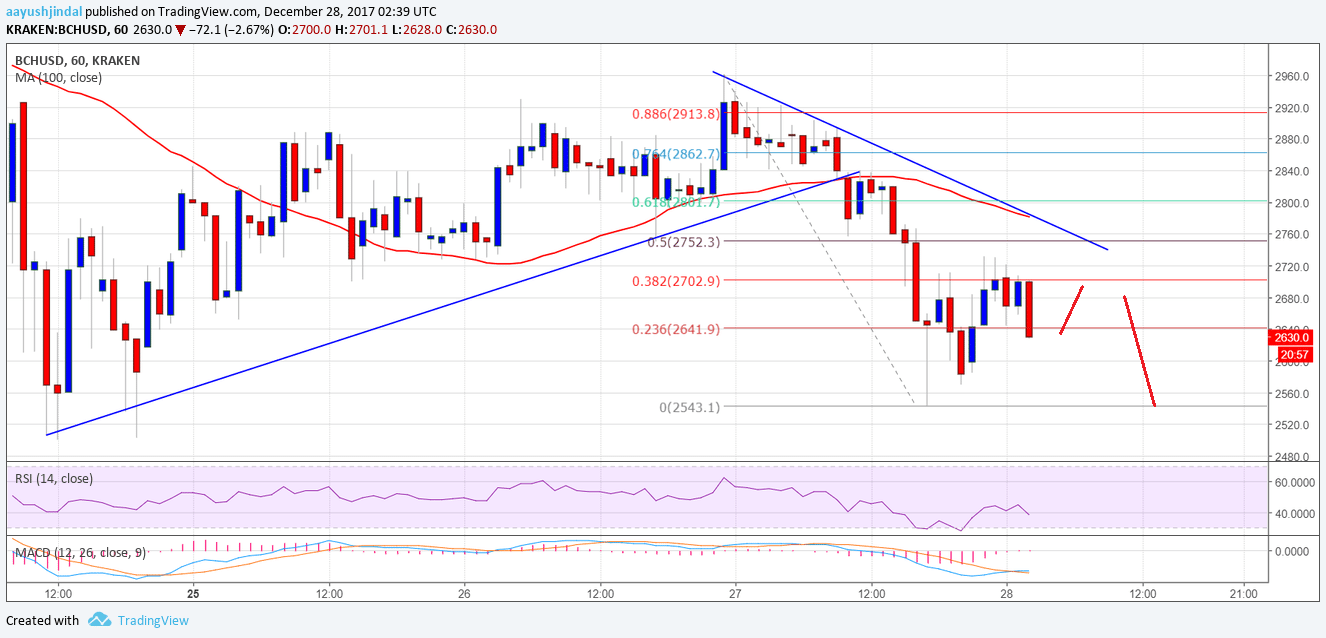
Therefore, it seems like the price is facing a major resistance at $2750. BCH might decline once again and retest the $2500 support area.
Looking at the technical indicators:
Hourly MACD – The MACD for BCH/USD is showing signs of a trend change.
Hourly RSI (Relative Strength Index) – The RSI for BCH/USD is still way below the 50 level.
Major Support Level – $2500
Major Resistance Level – $2750
Charts courtesy – Trading View, Kraken


