Key Points
- Bitcoin cash price found support near the $865 level and bounced back against the US Dollar.
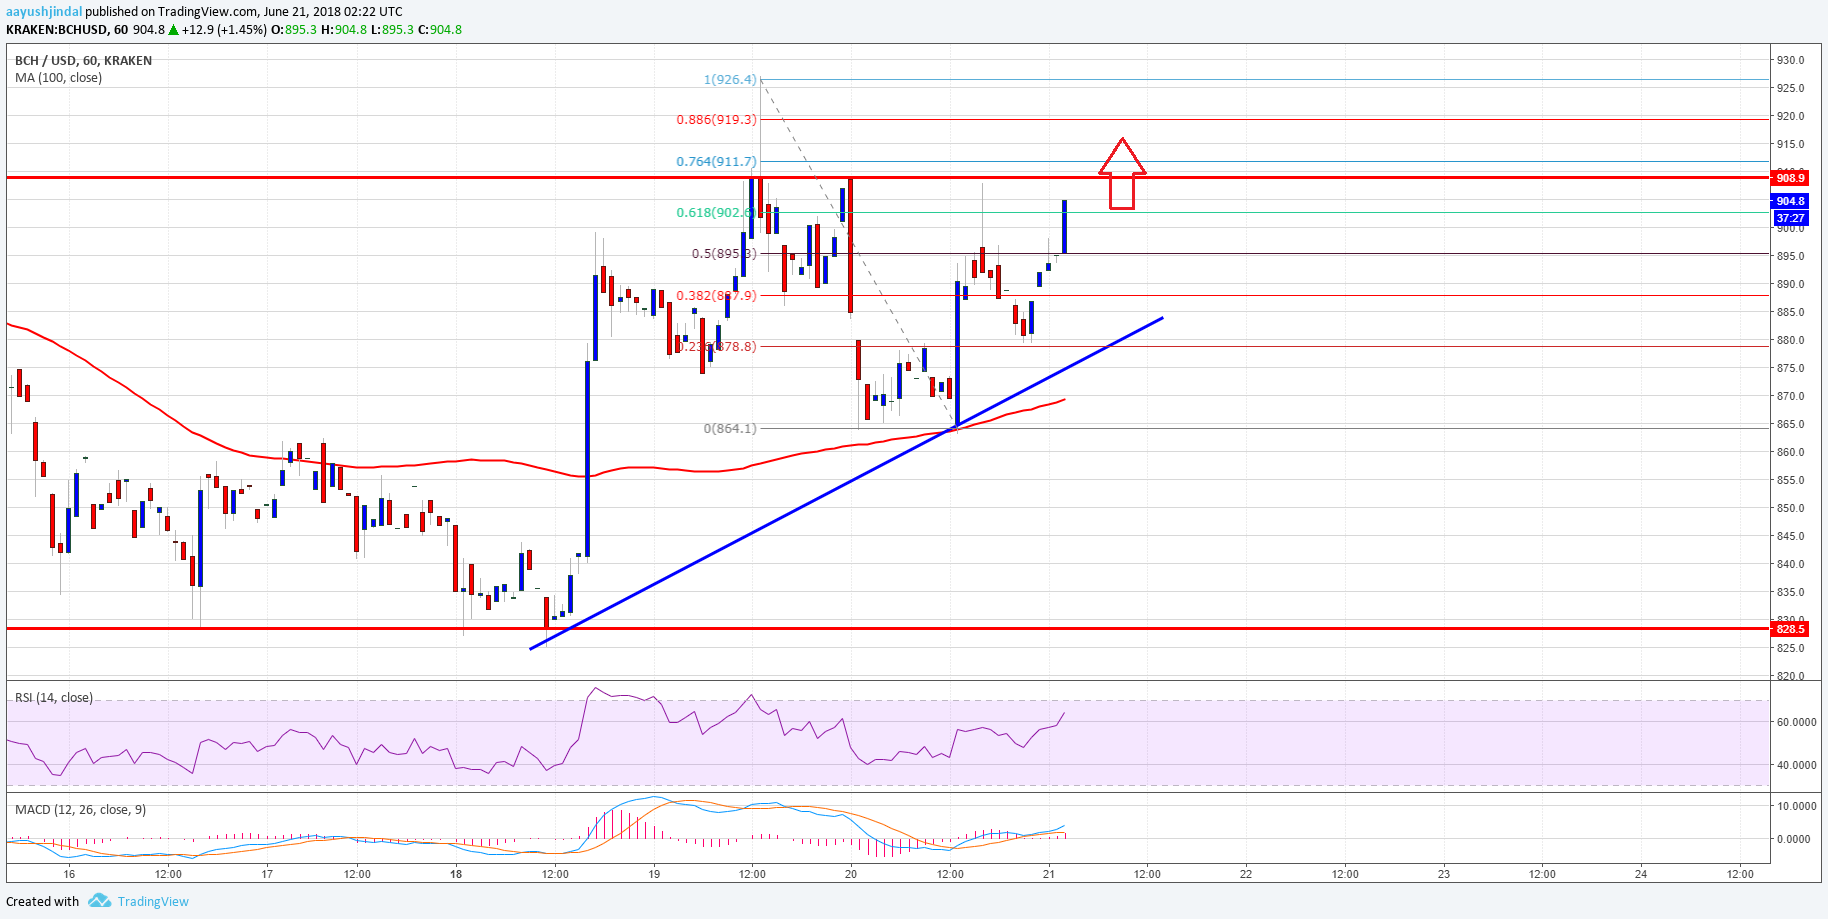
- Yesterday’s highlighted short-term bullish trend line is intact with support at $880 on the hourly chart of the BCH/USD pair (data feed from Kraken).
- The pair is moving higher and it may soon make an attempt to break the $908 resistance level.
Bitcoin cash price found support above $850 and recovered against the US Dollar. BCH/USD is resuming uptrend and it could break the $900-910 resistance.
Bitcoin Cash Price Trend
After a correction below the $880 level, bitcoin cash price found support against the US Dollar. The price tested the $865 level where buyers appeared and prevented more losses. Moreover, the 61.8% Fib retracement level of the last leg from the $825 low to $925 swing high also acted as a support. A fresh upward wave was initiated and the price bounced back above the $880 resistance level.
During the upside, the price broke the 50% Fib retracement level of the last decline from the $926 high to $865 low. The current price action is positive and suggests more gains above the $900 level. An initial hurdle for buyers is around the $908-910 zone. Moreover, the 76.4% Fib retracement level of the last decline from the $926 high to $865 low at $911 may also stop upsides. Should there be an upside break above $911, the price could kick start more gains above the $920 level. On the downside, yesterday’s highlighted short-term bullish trend line is intact with support at $880 on the hourly chart of the BCH/USD pair.

Looking at the chart, the price is well supported above the $880 level, the trend line, and the 100 hourly simple moving average.
Looking at the technical indicators:
Hourly MACD – The MACD for BCH/USD is currently in the bullish zone.
Hourly RSI (Relative Strength Index) – The RSI for BCH/USD is now well above the 50 level.
Major Support Level – $880
Major Resistance Level – $910


