Key Points
- Bitcoin cash price remained in a positive zone and is currently above the $500 support against the US Dollar.
- There is a key bearish trend line in place with resistance at $540 on the hourly chart of the BCH/USD pair (data feed from Kraken).
- The pair needs to trade above the $550 resistance and the 100 hourly simple moving average to gain traction.
Bitcoin cash price is currently consolidating above $500 against the US Dollar. BCH/USD must surpass the 100 hourly SMA to trade to a new weekly high.
Bitcoin Cash Price Analysis
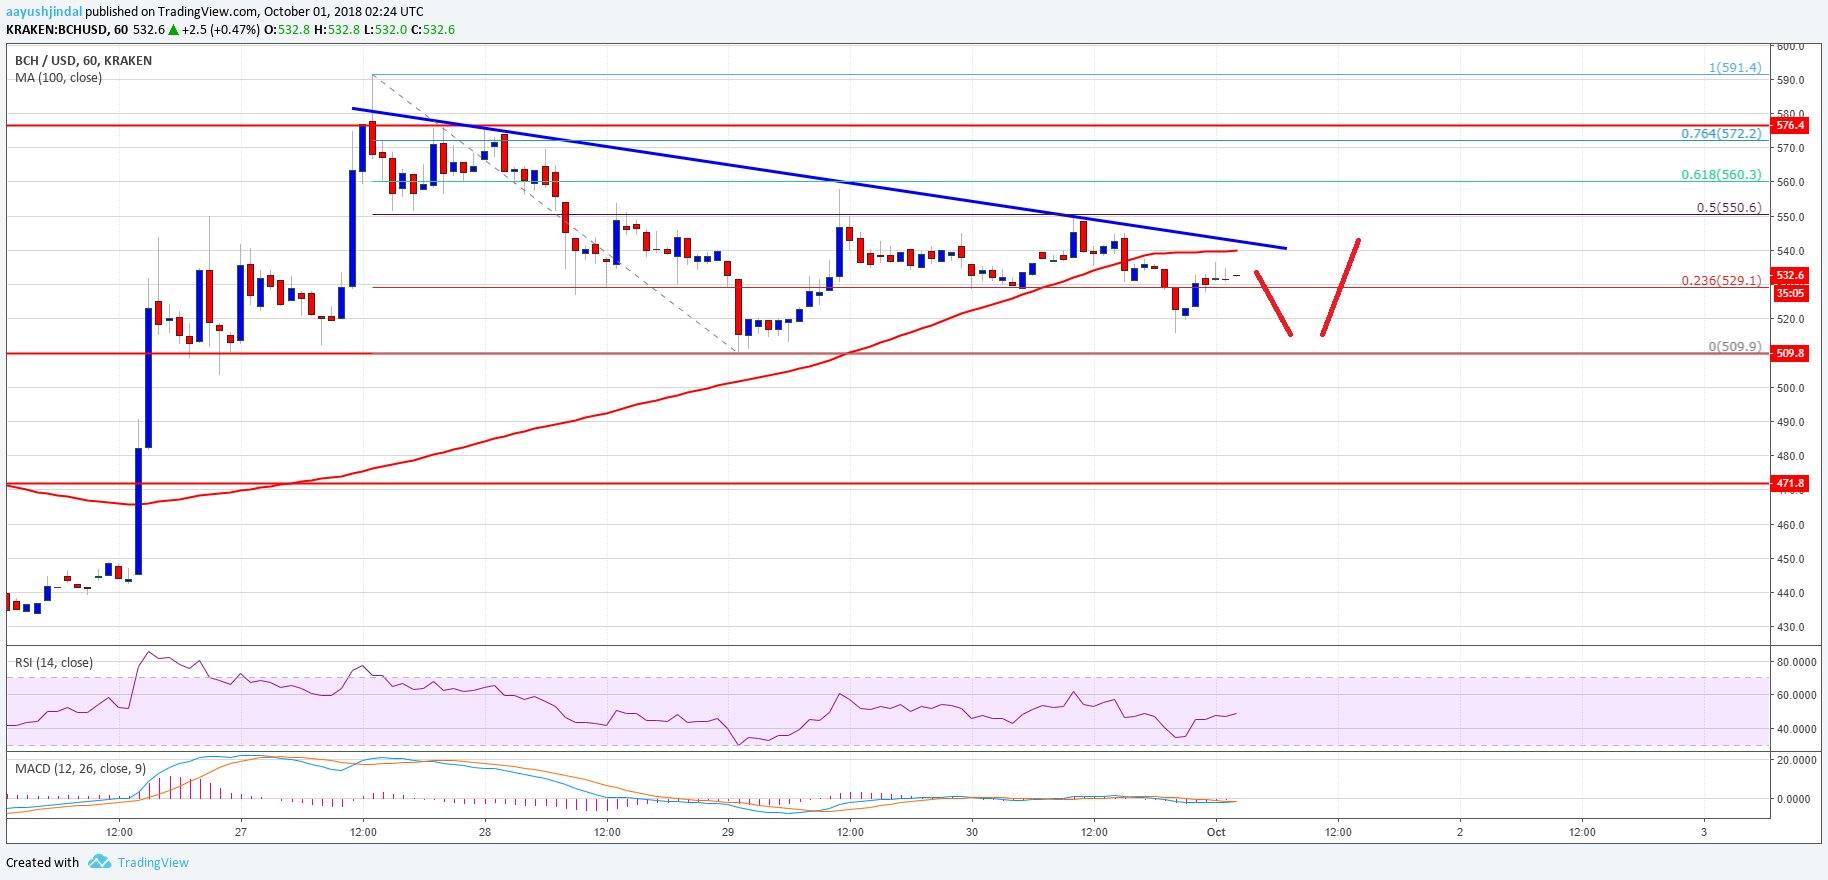
There were mostly positive moves above the $500 level in bitcoin cash price against the US Dollar. The BCH/USD pair recently corrected lower after trading towards the $600 level. It traded as low as $509 and later started consolidating. It traded above the 23.6% Fib retracement level of the last decline from the $591 high to $509 low. However, the upside move was capped by the $550 resistance zone.
More importantly, there is a key bearish trend line in place with resistance at $540 on the hourly chart of the BCH/USD pair. The pair also failed to clear the 50% Fib retracement level of the last decline from the $591 high to $509 low. Additionally, the 100 hourly simple moving average is also positioned near the $540 level. Therefore, the $540 and $550 levels are important hurdles for buyers. Above these, the price will most likely trade towards the $590 and $600 levels in the near term. On the downside, the key support is at $510.

Looking at the chart, BCH price is attempting to surpass the trend line, $540, and the 100 hourly SMA. However, buyers are struggling to gain momentum. Therefore, there could be a minor downside reaction before the price breaks $550.
Looking at the technical indicators:
Hourly MACD – The MACD for BCH/USD is slowly moving into the bullish zone.
Hourly RSI (Relative Strength Index) – The RSI for BCH/USD is currently near the 50 level.
Major Support Level – $510
Major Resistance Level – $550
