
Reason to trust
How Our News is Made
Strict editorial policy that focuses on accuracy, relevance, and impartiality
Ad discliamer
Morbi pretium leo et nisl aliquam mollis. Quisque arcu lorem, ultricies quis pellentesque nec, ullamcorper eu odio.
Key Points
- Bitcoin cash price remained in a positive zone and is currently above the $500 support against the US Dollar.
- There is a key bearish trend line in place with resistance at $540 on the hourly chart of the BCH/USD pair (data feed from Kraken).
- The pair needs to trade above the $550 resistance and the 100 hourly simple moving average to gain traction.
Bitcoin cash price is currently consolidating above $500 against the US Dollar. BCH/USD must surpass the 100 hourly SMA to trade to a new weekly high.
Bitcoin Cash Price Analysis
There were mostly positive moves above the $500 level in bitcoin cash price against the US Dollar. The BCH/USD pair recently corrected lower after trading towards the $600 level. It traded as low as $509 and later started consolidating. It traded above the 23.6% Fib retracement level of the last decline from the $591 high to $509 low. However, the upside move was capped by the $550 resistance zone.
More importantly, there is a key bearish trend line in place with resistance at $540 on the hourly chart of the BCH/USD pair. The pair also failed to clear the 50% Fib retracement level of the last decline from the $591 high to $509 low. Additionally, the 100 hourly simple moving average is also positioned near the $540 level. Therefore, the $540 and $550 levels are important hurdles for buyers. Above these, the price will most likely trade towards the $590 and $600 levels in the near term. On the downside, the key support is at $510.
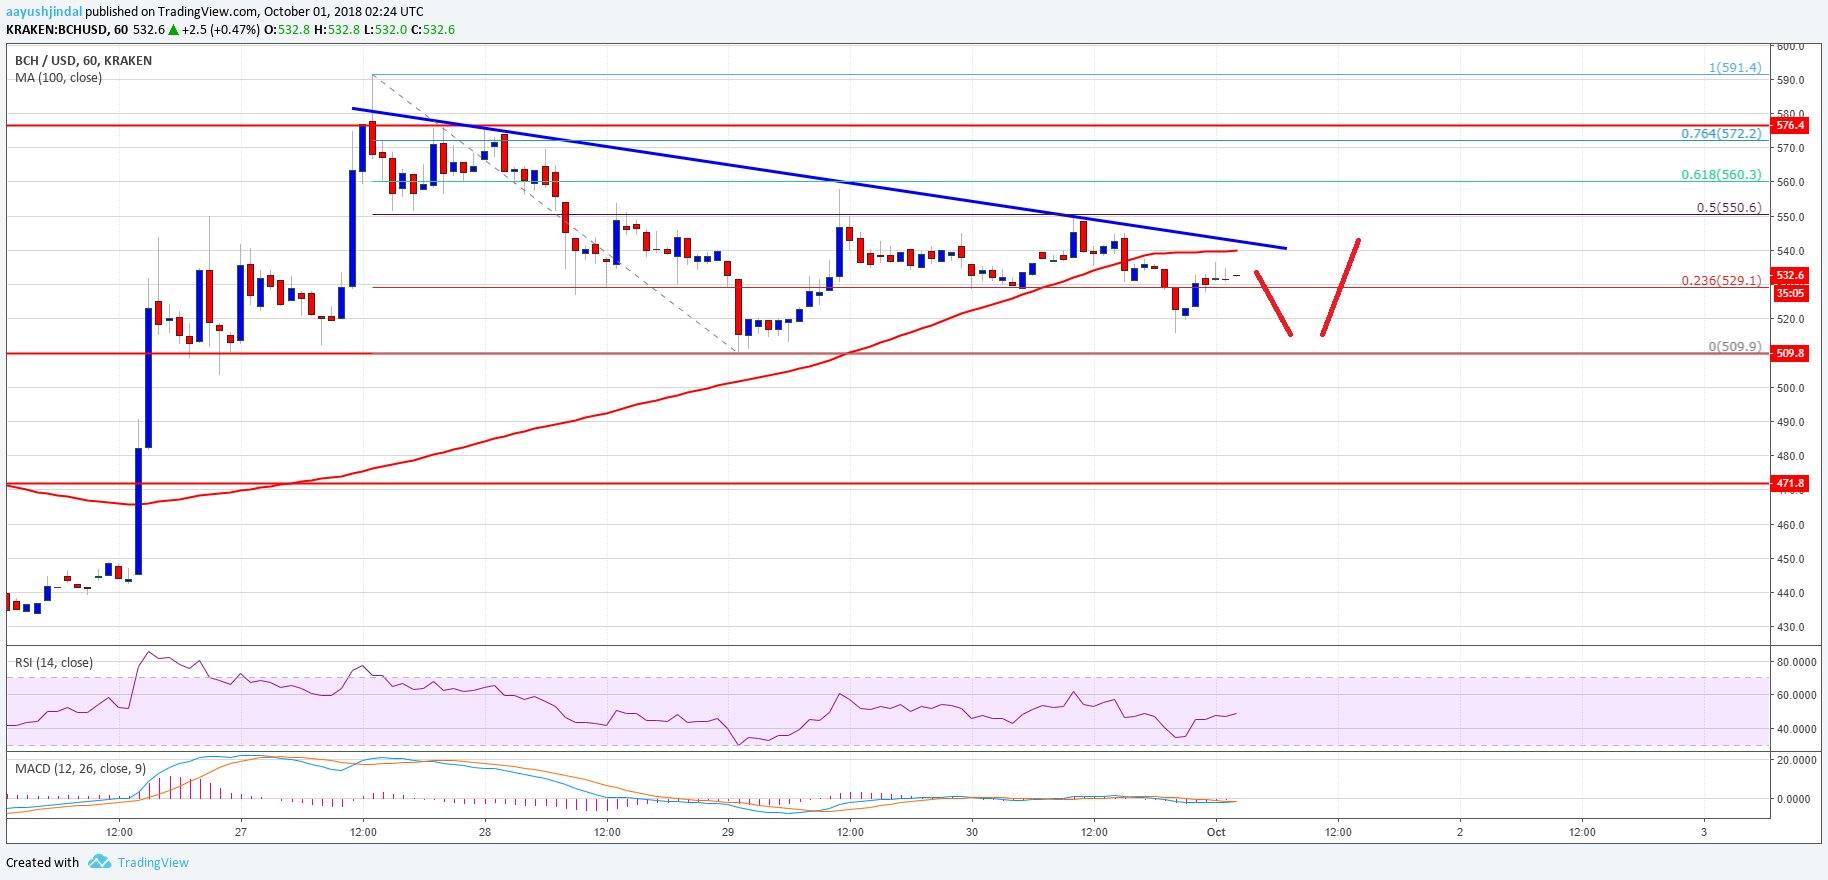
Looking at the chart, BCH price is attempting to surpass the trend line, $540, and the 100 hourly SMA. However, buyers are struggling to gain momentum. Therefore, there could be a minor downside reaction before the price breaks $550.
Looking at the technical indicators:
Hourly MACD – The MACD for BCH/USD is slowly moving into the bullish zone.
Hourly RSI (Relative Strength Index) – The RSI for BCH/USD is currently near the 50 level.
Major Support Level – $510
Major Resistance Level – $550


