Key Points
- Bitcoin cash price declined further and broke a major support at $1,150 against the US Dollar.
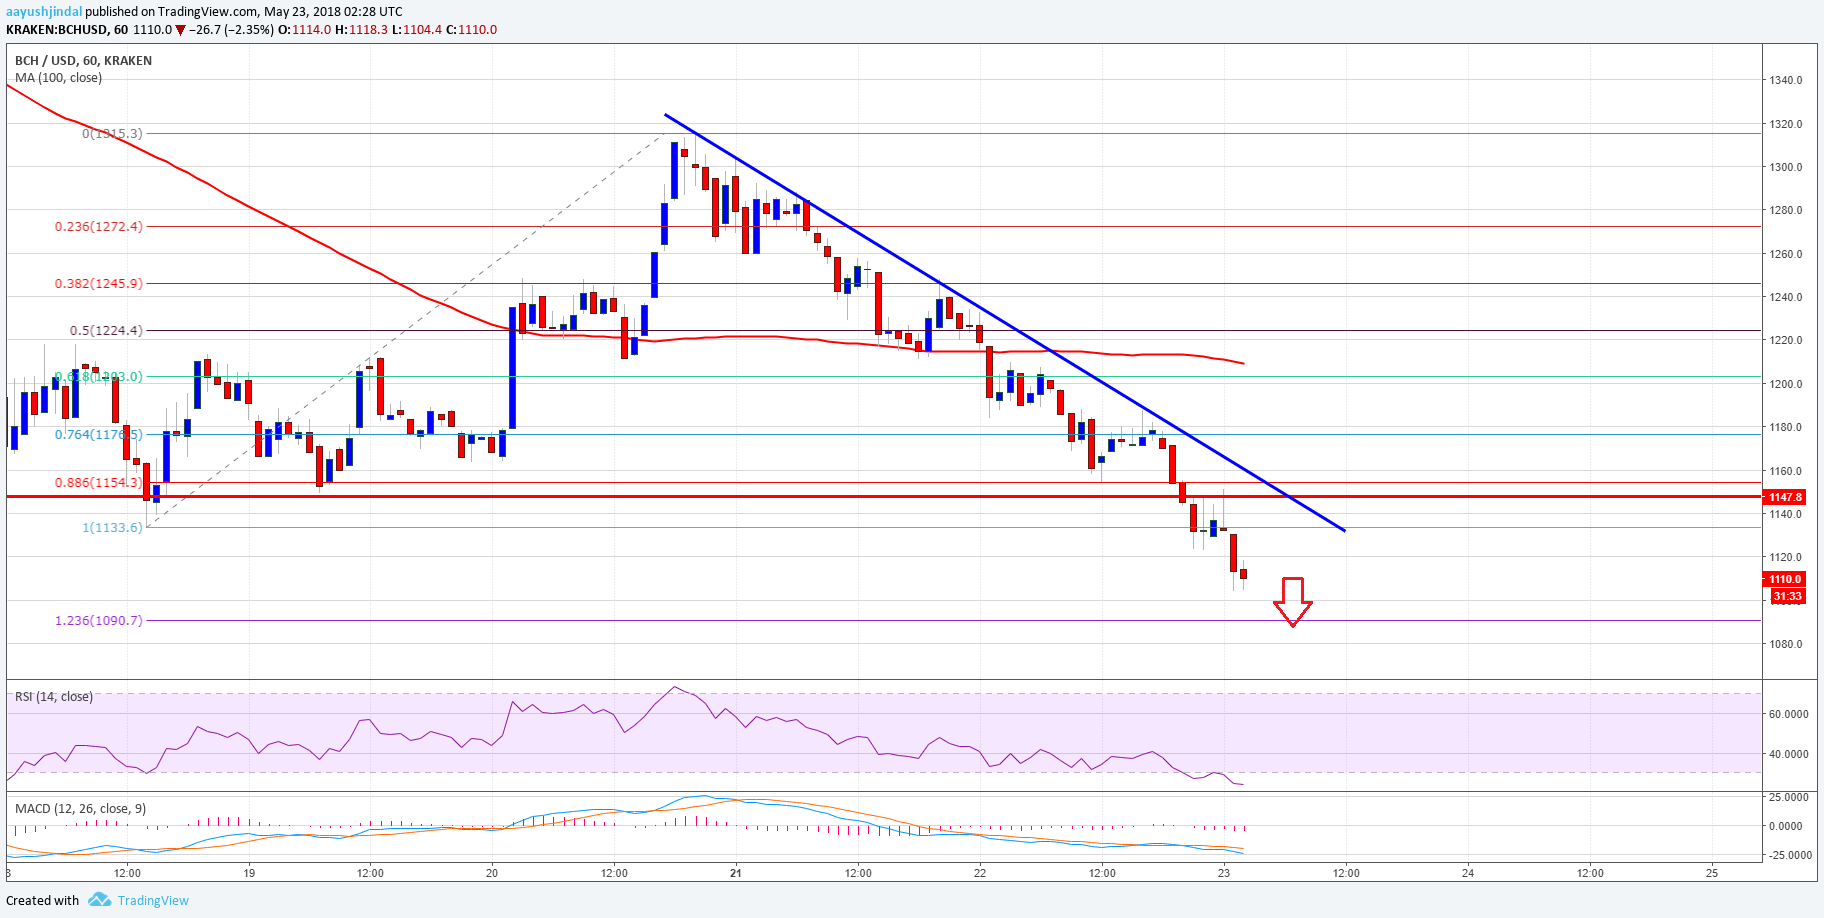
- There is a major bearish trend line forming with resistance at $1,160 on the hourly chart of the BCH/USD pair (data feed from Kraken).
- The pair may perhaps continue to move down and it could even break the $1,100 support level.
Bitcoin cash price is accelerating declines below $1,200 against the US Dollar. BCH/USD is now well below $1,150 and eyes a downside break below $1,100.
Bitcoin Cash Price Resistance
There was no major upside recovery in bitcoin cash price above $1,220 against the US Dollar. The mentioned $1,220 level acted as a hurdle for buyers, resulting in more declines. The price declined further, settled below the $1,200 level, and broke the $1,150 support level. The recent downside break below $1,150 has opened the doors for more losses in the near term.
The decline was such that the price even broke the last swing low of $1,133. It is now well below $1,150 and the 100 hourly simple moving average. It seems like the price is heading towards the 1.236 Fib extension level of the last wave from the $1,133 low to $1,315 high at $1,090. It means the price may perhaps break the $1,100 support and accelerate declines towards $1,050. If sellers remain in control, the price might test the 1.618 Fib extension level of the last wave from the $1,133 low to $1,315 high. On the upside, there is a major bearish trend line forming with resistance at $1,160 on the hourly chart of the BCH/USD pair.

Looking at the chart, the price is clearly under a lot of bearish pressure below $1,150. However, if buyers manage to push the price above $1,150-60, it could bounce back quickly.
Looking at the technical indicators:
Hourly MACD – The MACD for BCH/USD is now in the bearish zone.
Hourly RSI (Relative Strength Index) – The RSI for BCH/USD is in the oversold area.
Major Support Level – $1,090
Major Resistance Level – $1,150


