
Reason to trust
How Our News is Made
Strict editorial policy that focuses on accuracy, relevance, and impartiality
Ad discliamer
Morbi pretium leo et nisl aliquam mollis. Quisque arcu lorem, ultricies quis pellentesque nec, ullamcorper eu odio.
Key Points
- Bitcoin cash price is currently consolidating above the $535 support against the US Dollar.
- There is a key contracting triangle formed with resistance at $570 on the hourly chart of the BCH/USD pair (data feed from Kraken).
- The pair is likely to make the next move either above $570 or below $550 in the near term.
Bitcoin cash price is preparing for the next move against the US Dollar. BCH/USD could rally once again if there is a break above the $570 resistance.
Bitcoin Cash Price Analysis
Yesterday, we saw a solid upward move above the $550 resistance in bitcoin cash price against the US Dollar. The BCH/USD pair traded towards the $600 level and formed a high at $589. Later, there was a minor downside correction and the price traded below $550. There was also a break below the 23.6% Fib retracement level of the last upside from the $473 low to $489 high.
On the downside, the $535 level acted as a decent support and prevented further losses. Moreover, there was no break below the 50% Fib retracement level of the last upside from the $473 low to $489 high. The price is currently consolidating above the $535 support. More importantly, there is a key contracting triangle formed with resistance at $570 on the hourly chart of the BCH/USD pair. If the pair breaks the triangle resistance at $570, it will most likely revisit the $589 high. Above the stated high, the price could test the $600 level, which is a major barrier. On the other hand, a downside break below $550 may well push the price towards the $535 support.
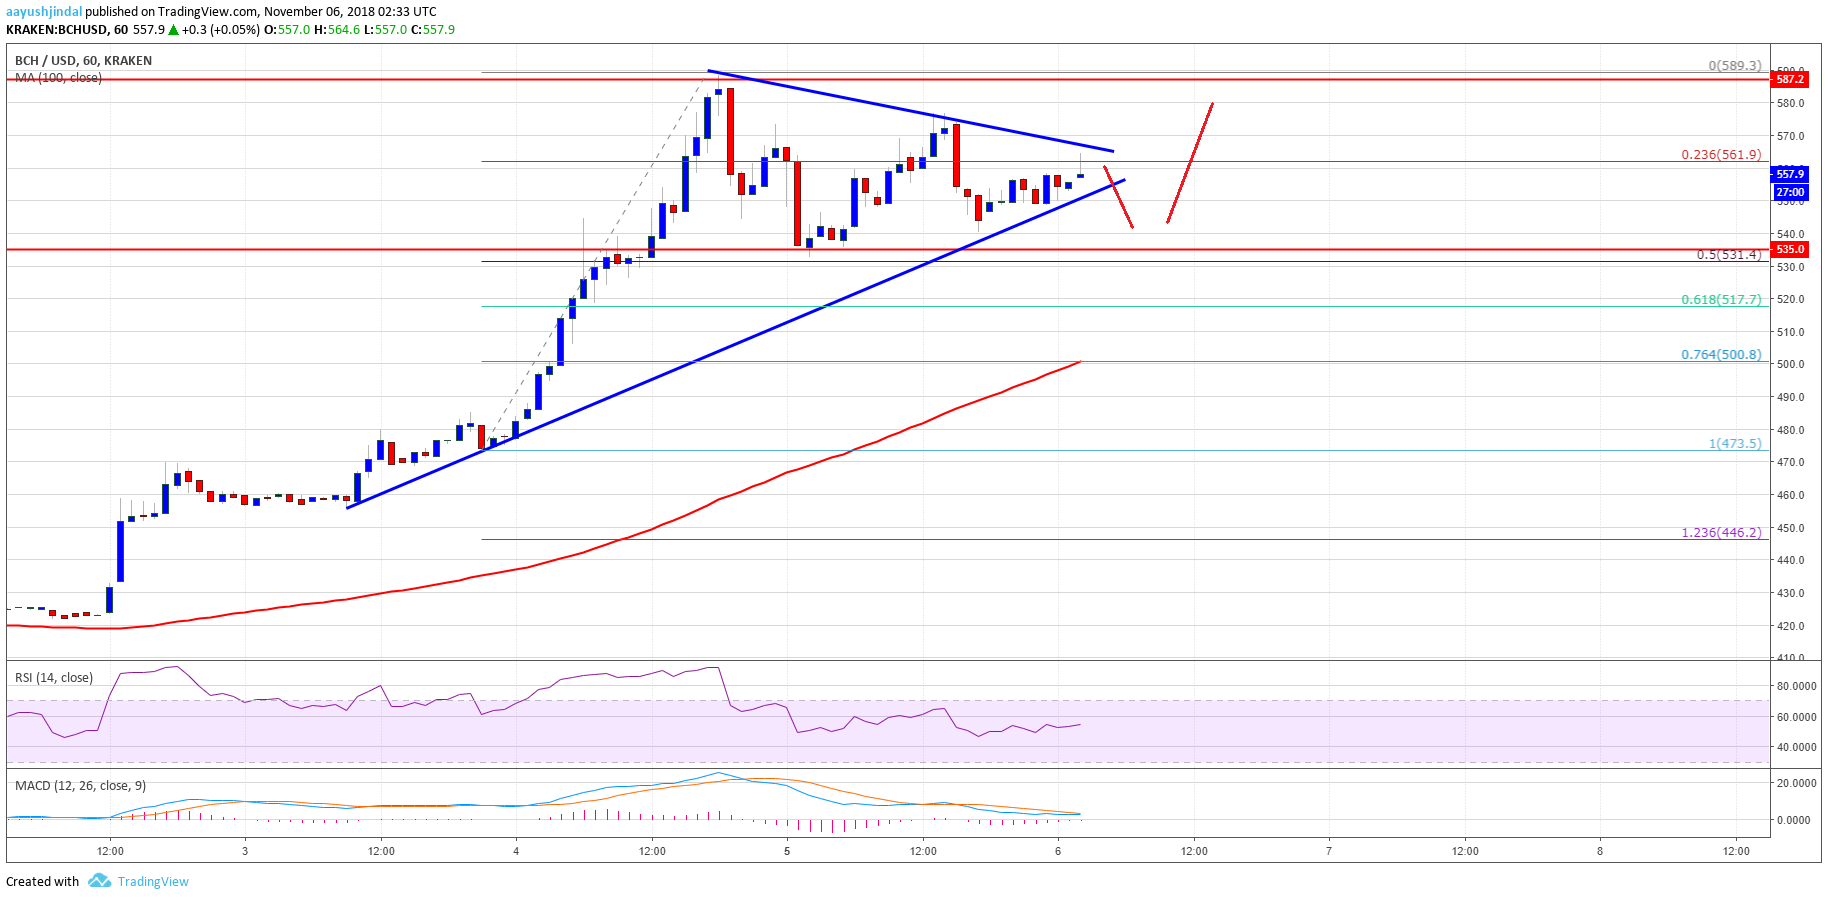
Looking at the chart, BCH price is preparing for the next move and it will either break $570 or move below $550 in the near term.
Looking at the technical indicators:
Hourly MACD – The MACD for BCH/USD is about to move into the bullish zone.
Hourly RSI (Relative Strength Index) – The RSI for BCH/USD is above the 50 level.
Major Support Level – $550
Major Resistance Level – $570


