
Reason to trust
How Our News is Made
Strict editorial policy that focuses on accuracy, relevance, and impartiality
Ad discliamer
Morbi pretium leo et nisl aliquam mollis. Quisque arcu lorem, ultricies quis pellentesque nec, ullamcorper eu odio.
Bitcoin price started a steady increase and tested the $56,500 zone against the US Dollar. BTC is now correcting gains, with many supports near $54,000.
- Bitcoin traded as high as $56,694 before starting a downside correction.
- The price is still above the $54,000 support and the 100 hourly simple moving average.
- There was a break below a key bullish trend line with support near $55,500 on the hourly chart of the BTC/USD pair (data feed from Kraken).
- The pair is likely to find a strong buying interest near the $54,000 support zone in the near term.
Bitcoin Price Remains Supported
After a clear break above the $53,200 resistance, bitcoin extended its rise. BTC broke the $55,000 resistance level and settled nicely above the 100 hourly simple moving average.
It even spiked above $56,500 and traded as high as $56,694. It is now correcting lower and trading below the $56,000 level. There was a break below the 23.6% Fib retracement level of the upward move from the $50,400 swing low to $56,694 high.
There was also a break below a key bullish trend line with support near $55,500 on the hourly chart of the BTC/USD pair. The pair is now consolidating near the $55,000 level.
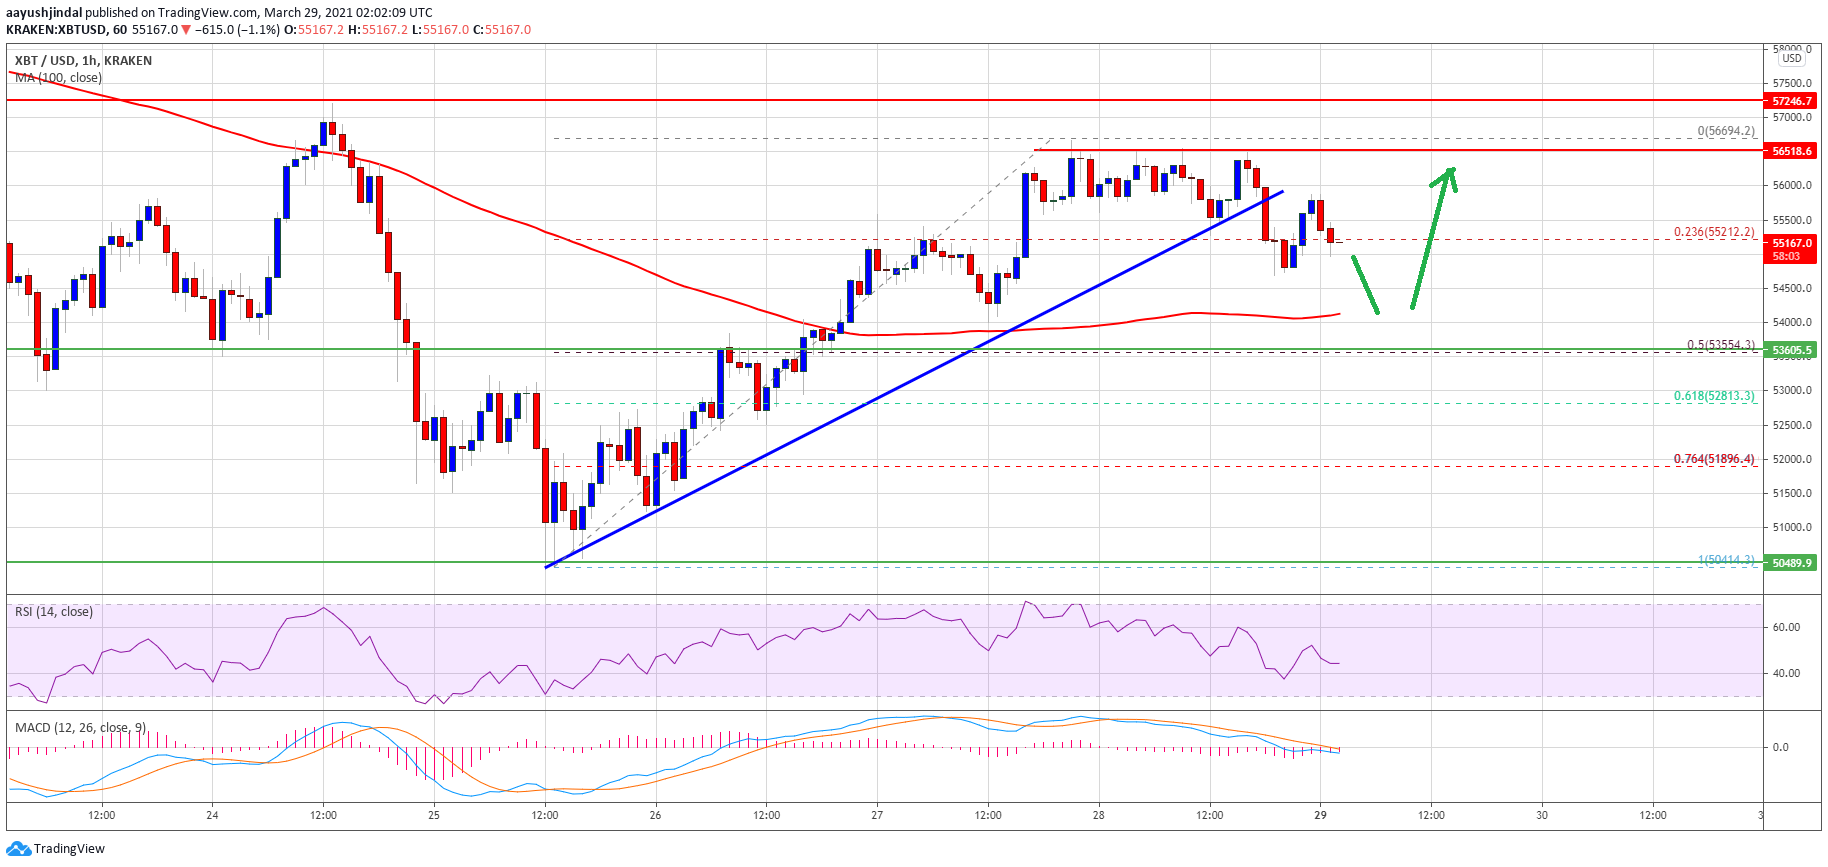
Source: BTCUSD on TradingView.com
An initial support on the downside is near the $54,500 level. The first major support is near the $54,000 zone and the 100 hourly simple moving average. The next major support is near the $53,500 level. It is close to the 50% Fib retracement level of the upward move from the $50,400 swing low to $56,694 high.
A downside break below the $53,500 and $53,200 support levels could negate the current bullish bias. In the stated case, the price is likely to revisit $50,500.
Fresh Increase in BTC?
If bitcoin stays above the $54,000 support zone and the 100 hourly SMA, there are chances of a fresh increase. An initial resistance on the upside is near the $56,200 zone.
The first major resistance is near the $56,500 level. The main resistance is still near $57,000 and $57,200, above which the price is likely to rally further.
Technical indicators:
Hourly MACD – The MACD is slowly losing momentum in the bullish zone.
Hourly RSI (Relative Strength Index) – The RSI for BTC/USD is now just below the 50 level.
Major Support Levels – $54,500, followed by $54,000.
Major Resistance Levels – $56,000, $56,500 and $57,200.