Reason to trust
How Our News is Made
Strict editorial policy that focuses on accuracy, relevance, and impartiality
Ad discliamer
Morbi pretium leo et nisl aliquam mollis. Quisque arcu lorem, ultricies quis pellentesque nec, ullamcorper eu odio.
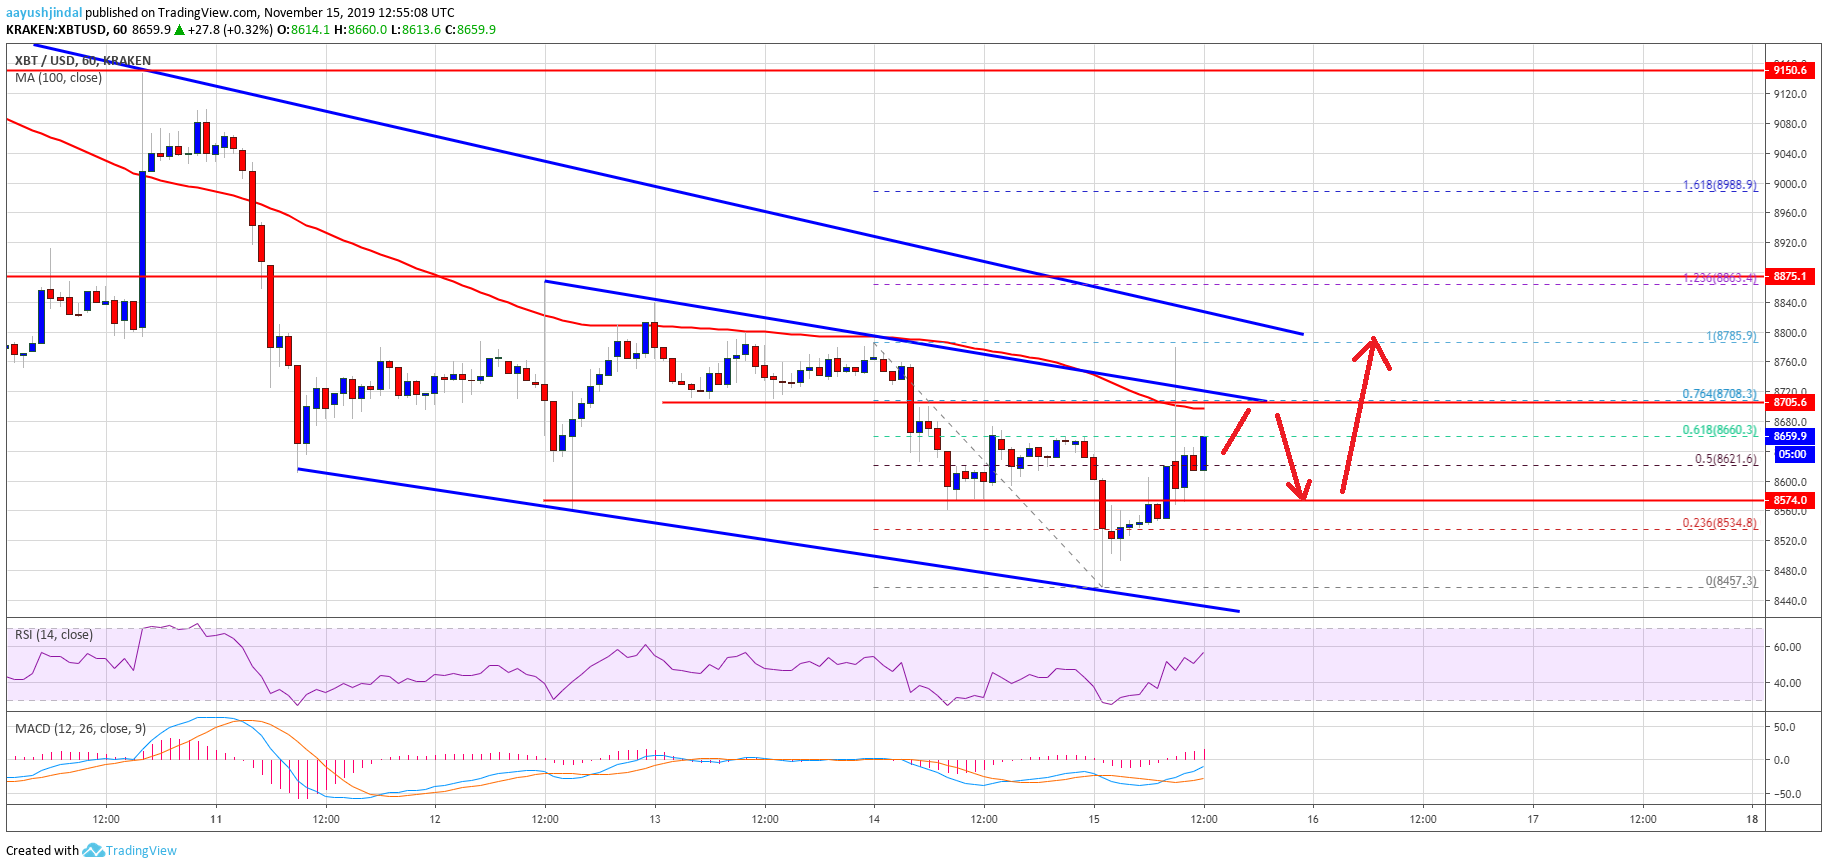
- Bitcoin price is currently correcting higher above the $8,600 resistance area against the US Dollar.
- The price is still facing a strong resistance near the $8,700 and $8,780 levels.
- Morning’s major declining channel is preventing gains near $8,705 on the hourly chart of the BTC/USD pair (data feed from Kraken).
- The price could correct further, but a clear break above $8,880 is needed for a convincing rise.
Bitcoin price is showing signs of an upside correction above $8,600 against the US Dollar. However, BTC is still facing a lot of hurdles near $8,780, $8,800 and $8,880.
Bitcoin Price Analysis
After trading to a new monthly low at $8,457, bitcoin started an upside correction against the US Dollar. BTC climbed above the $8,550 and $8,600 resistance levels to start the current correction.
Moreover, there was a break above the 50% Fib retracement level of the recent decline from the $8,785 high to $8,457 low. Finally, there was a spike above the $8,650 resistance area.
However, the upward move was capped by the $8,700 resistance the 100 hourly simple moving average. More importantly, morning’s major declining channel is preventing gains near $8,705 on the hourly chart of the BTC/USD pair.
Besides, it seems like the 76.4% Fib retracement level of the recent decline from the $8,785 high to $8,457 low is also acting as a strong resistance.
If there is a clear break above the channel resistance, $8,720, and the 100 hourly SMA, the price is likely to continue to higher. The next key resistance is near the $8,780 level. The main resistance is still near the $8,880 level and a connecting bearish trend line on the same chart.
Above $8,880, bitcoin is likely to continue to higher towards $9,000 and $9,250. Conversely, the price might fail to continue above $8,780 or $8,880. In the mentioned case, the $8,550 level is likely to provide support in the near term.
If the price struggles to hold the $8,550 support area, there are high chances of another break below $8,500 or even $8,450. The next major support is near the $8,300 and $8,200 levels.
Looking at the chart, bitcoin is showing a few positive signs above the $8,600 level. Having said that, the bulls need to gains strength above $8,700 and $8,720. If not, the price will most likely start a fresh decline back towards the $8,550 and $8,450 support levels.
Technical indicators:
Hourly MACD – The MACD is currently gaining momentum in the bullish zone.
Hourly RSI (Relative Strength Index) – The RSI for BTC/USD is currently rising and it is well above the 50 level.
Major Support Levels – $8,550 followed by $8,450.
Major Resistance Levels – $8,720, $8,780 and $8,880.