Reason to trust
How Our News is Made
Strict editorial policy that focuses on accuracy, relevance, and impartiality
Ad discliamer
Morbi pretium leo et nisl aliquam mollis. Quisque arcu lorem, ultricies quis pellentesque nec, ullamcorper eu odio.
- There was a strong buying interest for bitcoin near the $6,800 support area against the US Dollar.
- The price started a fresh increase and broke the $7,000 and $7,500 resistance levels.
- There was a break above a major contracting triangle with resistance near $7,300 on the 4-hours chart of the BTC/USD pair (data feed from Kraken).
- The pair is eyeing a strong rise and it could trade above $8,500 and $8,800 in the near term.
Bitcoin price is up more than 10% after a strong downside correction against the US Dollar. BTC is now eying further upsides and it could even test the $9,000 resistance area.
Bitcoin Price Weekly Analysis (BTC)
This past week, bitcoin price rallied significantly above the $7,000 resistance against the US Dollar. The BTC/USD pair broke many barriers near $7,000, $7,200 and $7,800. The pair even surged above the $8,000 level and traded to a new 219 high near the $8,360 level. Later, there was a sharp downside correction below the $8,000 support, but the price stayed well above the 100 simple moving average (4-hours). It broke the $7,200 support area, but found a strong buying interest near the $6,650 and $6,800 levels.
A swing low was formed at $6,645 and the price recently recovered nicely. It climbed sharply above the $7,000 and $7,200 resistance levels. Moreover, there was a break above the 50% Fib retracement level of the downside correction from the $8,362 high to $6,645 low. More importantly, there was a break above a major contracting triangle with resistance near $7,300 on the 4-hours chart of the BTC/USD pair. The pair is now trading above the $7,700 resistance and the 61.8% Fib retracement level of the downside correction from the $8,362 high to $6,645 low.
These all are positive signs and it seems like the price may continue to surge above the $8,000 barrier. The next key resistance above $8,000 is near the $8,350 level. If the bulls gains pace above $8,362 swing high, it will most likely open the doors for a sharp rally towards the $8,600 and $8,800 resistance levels.
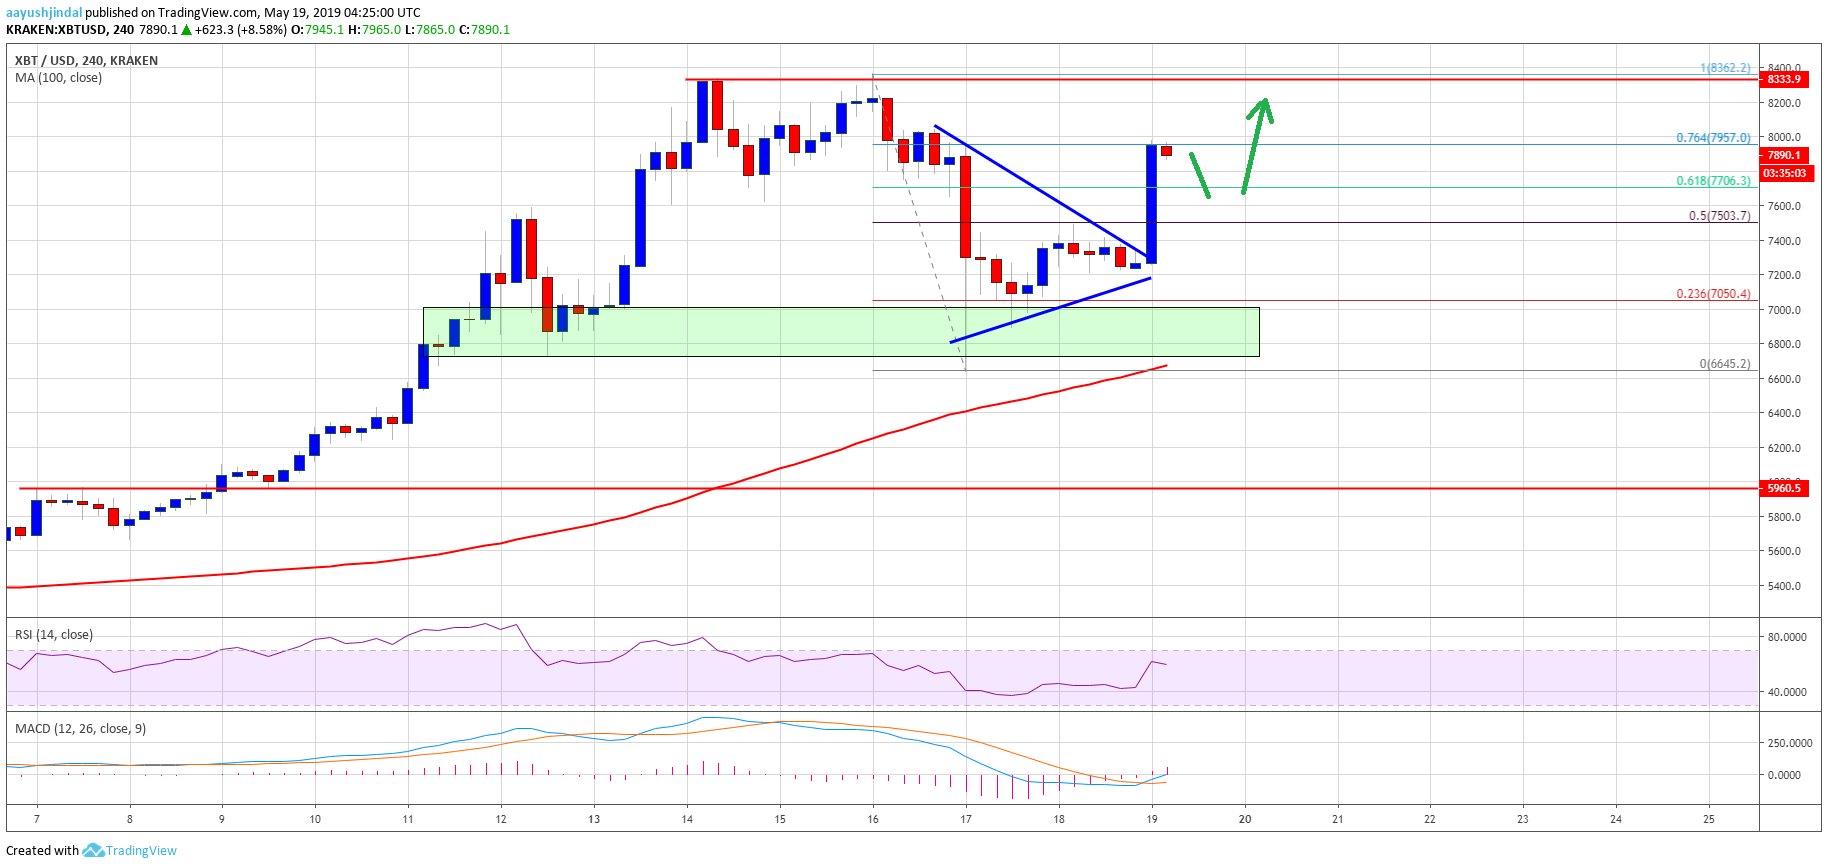
Looking at the chart, bitcoin price rebounded nicely after a strong decline towards $6,650. It is now up more than 10% and it seems like it could continue higher towards $8,200 and $8,500. The main target for the bulls in the coming sessions could be $8,800 or even $9,000. The key supports on the downside are near $7,500, $7,200 and $7,000.
Technical indicators
4 hours MACD – The MACD for BTC/USD is gaining pace in the bullish zone.
4 hours RSI (Relative Strength Index) – The RSI for BTC/USD is back above 50 and it could continue towards 70.
Major Support Level – $7,200
Major Resistance Level – $8,350