
Reason to trust
How Our News is Made
Strict editorial policy that focuses on accuracy, relevance, and impartiality
Ad discliamer
Morbi pretium leo et nisl aliquam mollis. Quisque arcu lorem, ultricies quis pellentesque nec, ullamcorper eu odio.
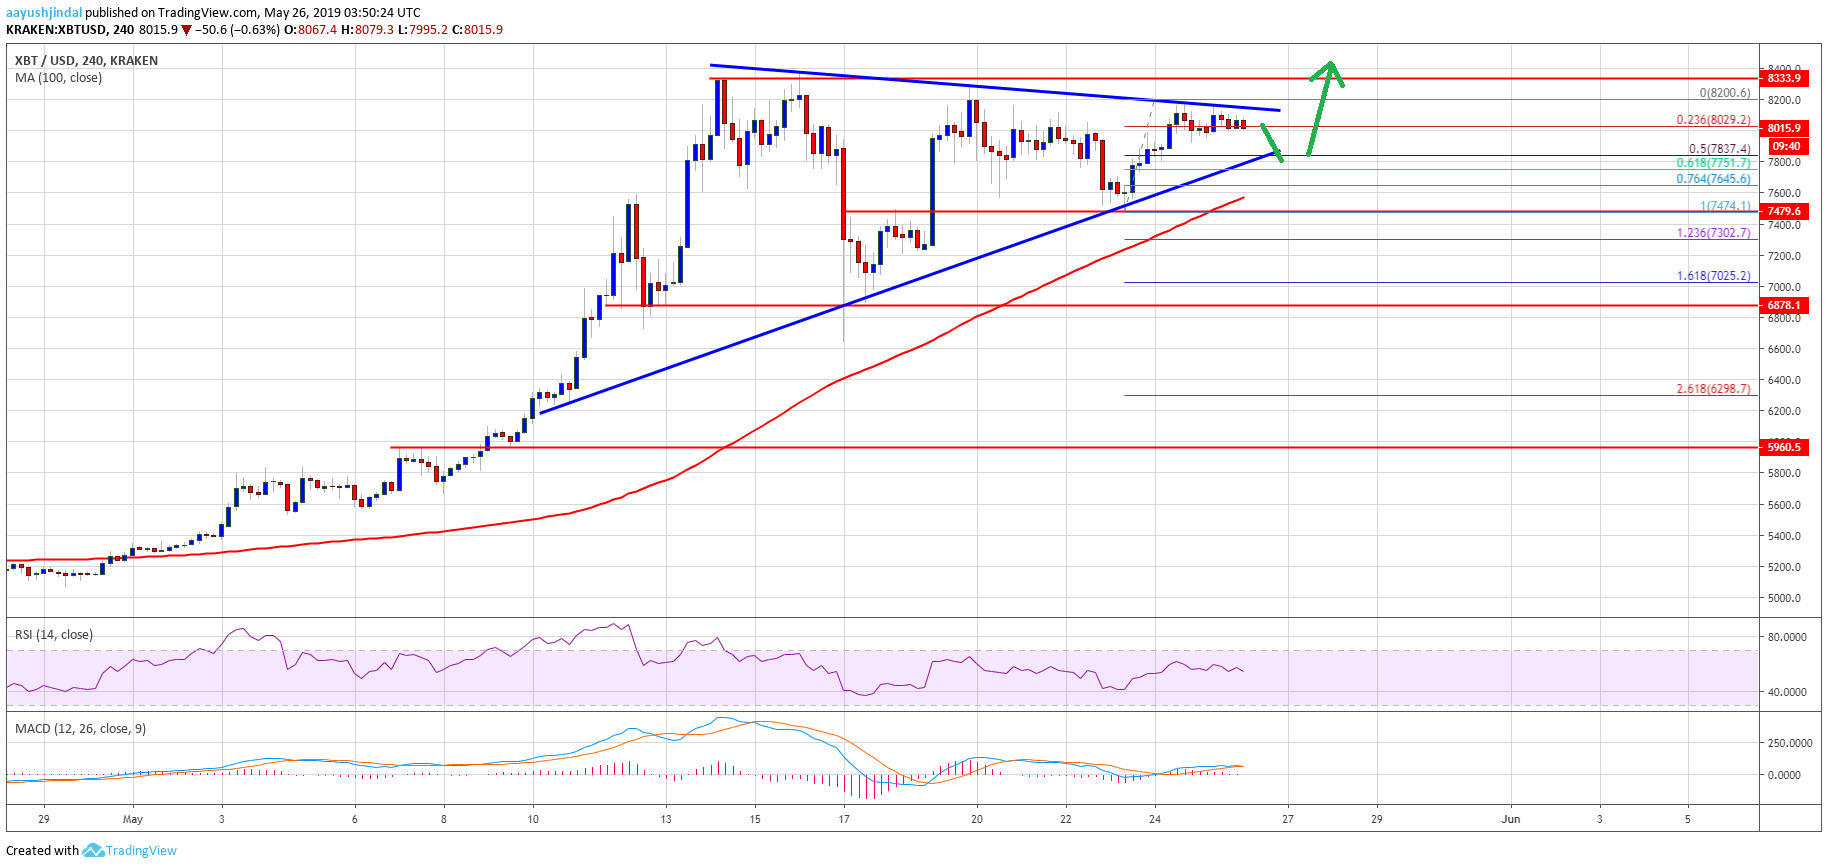
- There is a strong resistance forming for bitcoin near the 8,200-8,300 area against the US Dollar.
- The price is placed nicely above the $7,840 and $7,600 support levels.
- There is a crucial contracting triangle forming with resistance near $8,200 on the 4-hours chart of the BTC/USD pair (data feed from Kraken).
- The pair is likely to break higher and surge once it clears the key $8,300 resistance area.
Bitcoin price is holding gains above $7,800 and $8,000 against the US Dollar. BTC seems to be setting up for a monster bullish break above $8,300 in the near term.
Bitcoin Price Weekly Analysis (BTC)
This past week, bitcoin price corrected lower below $7,660 against the US Dollar. The BTC/USD pair even broke the $7,600 support level and traded as low as $7,474. However, dips remain protected and the price recently bounced back above $7,600 and $7,800. There was a strong upward move above the $8,000 level and the price remained well above the 100 simple moving average (4-hours). The price tested the $8,200 resistance level and it is currently correcting gains.
An immediate support is near the $7,950 level. The main support is near the $7,840 level, and the 23.6% Fib retracement level of the recent wave from the $7,474 low to $8,200 high. More importantly, it seems like there is a crucial contracting triangle forming with resistance near $8,200 on the 4-hours chart of the BTC/USD pair. If there is a downside break below the triangle support at $7,840, the price could test the $7,600 support. The 100 simple moving average (4-hours) is also near the $7,600 level.
If there is a daily close below the $7,600 and $7,500 levels, the price may perhaps start a strong downward move. Conversely, if there is an upside break above the $8,200 resistance, the price could start a strong rally. The next immediate resistance is at $8,300, above which the next target might be $8,500 or $8,800.
Looking at the chart, bitcoin price is clearly forming a crucial breakout pattern with resistance near $8,200. A successful close above the $8,200 and $8,300 resistances is likely to start a strong upward move. If the bulls continue to struggle near $8,200 or $8,300, there might be a fresh decline. On the downside, the $7,500 support area holds the key. A successful close below $7,500 is likely to push the bulls on the back foot.
Technical indicators
4 hours MACD – The MACD for BTC/USD is likely to move into the bearish zone.
4 hours RSI (Relative Strength Index) – The RSI for BTC/USD is currently above the level 50 and it could move higher.
Major Support Level – $7,500
Major Resistance Level – $8,300


