
Reason to trust
How Our News is Made
Strict editorial policy that focuses on accuracy, relevance, and impartiality
Ad discliamer
Morbi pretium leo et nisl aliquam mollis. Quisque arcu lorem, ultricies quis pellentesque nec, ullamcorper eu odio.
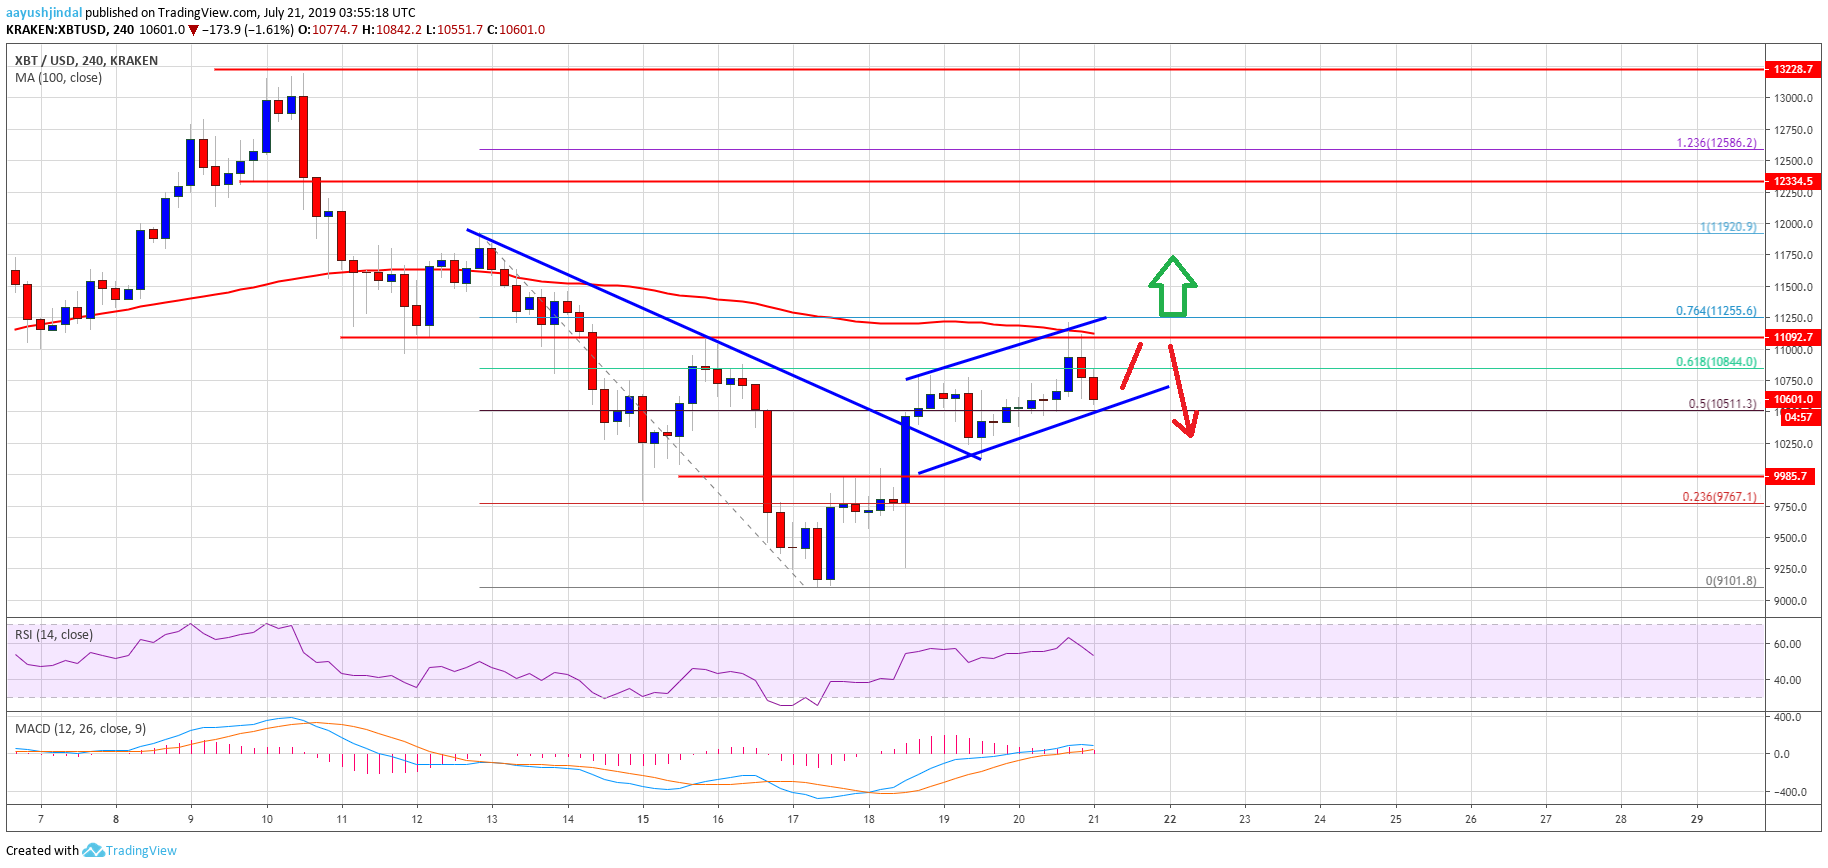
- There was a solid upside correction initiated from the $9,100 swing low against the US Dollar.
- The price gained traction after it broke the key $10,000 resistance area and traded towards $11,250.
- There was a break above a major bearish trend line with resistance at $10,400 on the 4-hours chart of the BTC/USD pair (data feed from Kraken).
- The pair tested a crucial resistance near $11,250 and it is currently correcting lower.
Bitcoin price is showing positive signs above the $10,250 support against the US Dollar. However, BTC must break the $11,250 resistance zone to continue higher in the near term.
Bitcoin Price Weekly Analysis (BTC)
This past week, bitcoin price extended its decline below the $10,000 support against the US Dollar. The BTC/USD pair even broke the $9,500 support and settled below the 100 simple moving average (4-hours). Finally, the price traded close to the $9,000 and formed a swing low near $9,100. A support base is formed above $9,200 and the price started an upside correction.
The recent wave was positive as the price broke the $10,000 and $10,250 resistance levels. The price even surpassed the 50% Fib retracement level of the last major slide from the $11,920 swing high to $9,101 swing low. Moreover, there was a break above a major bearish trend line with resistance at $10,400 on the 4-hours chart of the BTC/USD pair. The price climbed above the $10,800 resistance and even spiked above the $11,000 level.
However, the upward move was capped by the $11,250 resistance area and the 100 simple moving average (4-hours). The 76.4% Fib retracement level of the last major slide from the $11,920 swing high to $9,101 swing low also acted as a strong resistance. As a result, the price started a downside correction below the $11,000 level. At the outset, it seems like there is a rising channel forming with support near $10,500.
If there is a downside break below the channel support, the price could decline towards the $10,250 or $10,000 support area. On the upside, the main resistance is near the $11,250 level and the 100 simple moving average (4-hours). A successful close above the $11,250 is must for more gains. If not, the price could start a fresh decrease below $10,500.
Looking at the chart, bitcoin price clearly tested a crucial resistance near $11,250. Therefore, a clear break above $11,250 is needed for the bulls to gain control in the coming sessions.
Technical indicators
4 hours MACD – The MACD for BTC/USD is struggling to gain traction in the bullish zone.
4 hours RSI (Relative Strength Index) – The RSI for BTC/USD is still above the 50 level.
Major Support Level – $10,250
Major Resistance Level – $11,250