
Reason to trust
How Our News is Made
Strict editorial policy that focuses on accuracy, relevance, and impartiality
Ad discliamer
Morbi pretium leo et nisl aliquam mollis. Quisque arcu lorem, ultricies quis pellentesque nec, ullamcorper eu odio.
- Bitcoin price surged more than 15% and cleared the main $4,200 resistance against the US Dollar.
- The price rallied close to the $5,000 and $5,200 resistance levels, where sellers emerged.
- There was a break above a crucial contracting triangle with resistance at $4,200 on the daily chart of the BTC/USD pair (data feed from Kraken).
- The pair almost touched a strong resistance zone near $5,000 before pulling back to $4,750.
Bitcoin price rallied above $4,200, $4,400 and $4,750 against the US Dollar. BTC traded towards the $5,000 resistance and it is currently correcting lower.
Bitcoin Price Analysis
In the past few analysis, we discussed the importance of the $4,140 and $4,200 resistances for bitcoin price against the US Dollar. The BTC/USD pair formed a solid support base above the $3,900 level and it recently settled above the $4,000 pivot level. It opened the doors for more upsides since the price even settled above the $4,100 and the 100-day simple moving average. Today, bulls gained momentum, resulting in a strong upside break above the $4,200 and $4,400 resistance levels.
More importantly, there was a break above a crucial contracting triangle with resistance at $4,200 on the daily chart of the BTC/USD pair. These are strong bullish signs since the price settled above the $4,200 and $4,400 hurdles. The market sentiment improved and the price even spiked above the 50% Fib retracement level of the last decline from the $6,546 high to $3,122 swing low. The price even climbed towards the $5,200 barrier, but it failed to retain momentum.
There was no test of the 61.8% Fib retracement level of the last decline from the $6,546 high to $3,122 swing low. BTC retreated from highs and it is currently trading near the $4,750 level. On the downside, there are many supports near the $4,400 level. The recent rally above key resistances has cleared the path for more upsides above $5,000. If there is a downside correction, the previous important resistance at $4,200 is likely to act as a strong support.
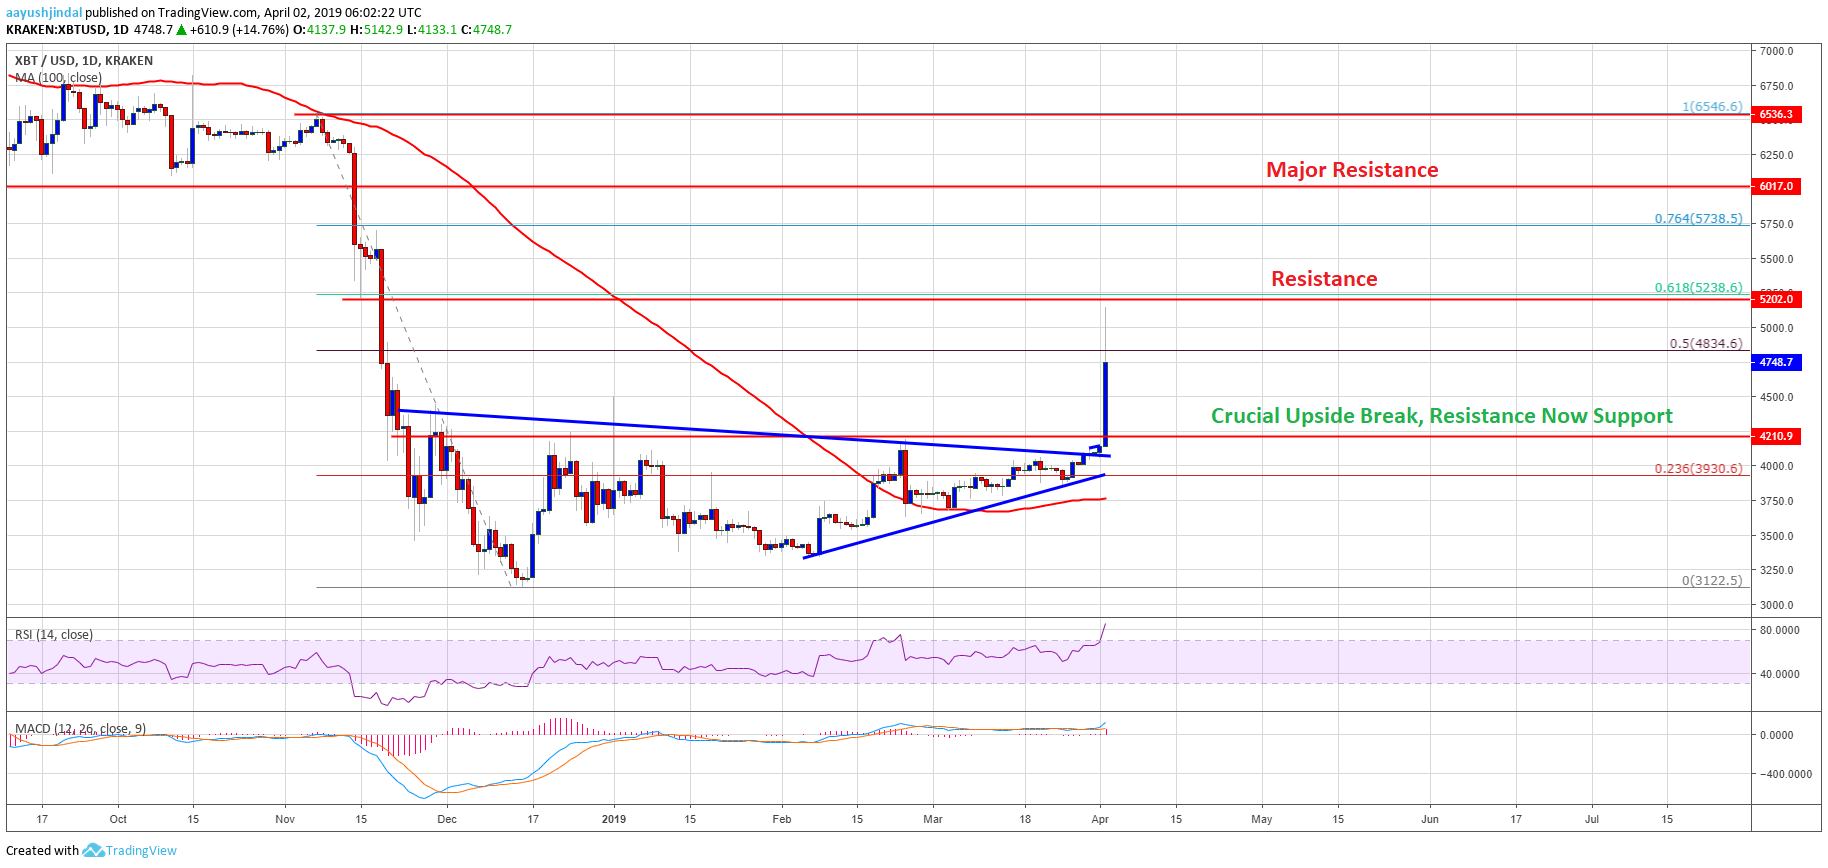
Looking at the chart, bitcoin price cleared surged after it broke the main $4,200 resistance. These are strong bullish signs, increasing chances of more upsides in the coming days. The next major resistance to watch out is at $5,200. If buyers even manage to surpass $5,200, the previous breakdown support at $6,000 could be tested (a strong sell zone).
Technical indicators:
Daily MACD – The MACD is gaining momentum in the bullish zone.
Daily RSI (Relative Strength Index) – The RSI for BTC/USD surged above the 70 level with many positive signs.
Major Support Levels – $4,400 followed by $4,200.
Major Resistance Levels – $4,850, $5,000 and $5,200.