
Reason to trust
How Our News is Made
Strict editorial policy that focuses on accuracy, relevance, and impartiality
Ad discliamer
Morbi pretium leo et nisl aliquam mollis. Quisque arcu lorem, ultricies quis pellentesque nec, ullamcorper eu odio.
- Bitcoin price surged more than 20% and even cleared the $5,000 resistance against the US Dollar.
- The price traded towards the $5,100 resistance and it is currently consolidating gains.
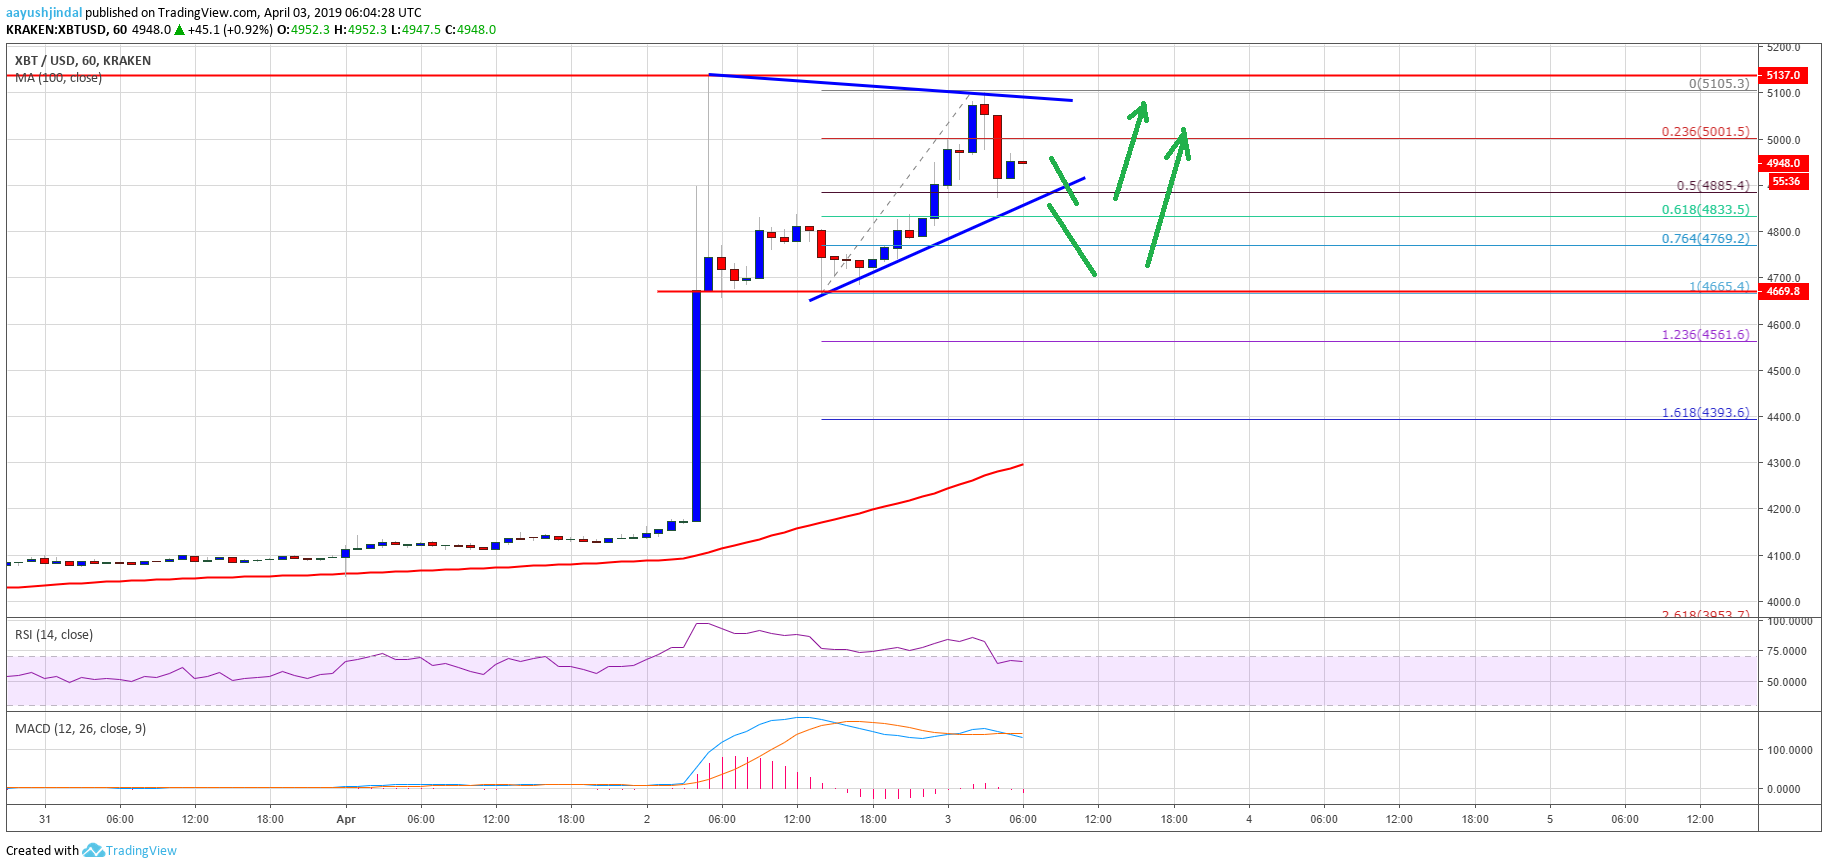
- There is a major contracting triangle forming with support at $4,880 on the hourly chart of the BTC/USD pair (data feed from Kraken).
- The pair could decline in the short term, but it remains well supported above $4,650.
Bitcoin price rally gathered pace above $4,800 and $5,000 against the US Dollar. BTC is currently consolidating gains, but it is likely to accelerate further above $5,100 in the near term.
Bitcoin Price Analysis
Yesterday, there was the start of a strong rise in bitcoin price above the $4,000 pivot level against the US Dollar. The BTC/USD pair rallied significantly above the $4,500 and $4,700 resistance levels. Bulls gained control and they even succeeded in clearing the $5,000 resistance. The price is up more than 25% from lows and it recently traded towards the $5,100 level. A new 2019 high was formed near $5,105 and the price recently started consolidating gains.
There was a correction below the $5,000 level and the 23.6% Fib retracement level of the recent wave from the $4,665 low to $5,105 high. However, losses were supported by the $4,900 level. The price tested the 50% Fib retracement level of the recent wave from the $4,665 low to $5,105 high. It is currently trading well above the $4,650 support area and the 100 hourly simple moving average.
Besides, there is a major contracting triangle forming with support at $4,880 on the hourly chart of the BTC/USD pair. If there is a downside break below the $4,880 support, the price could test the $4,660 and $4,650 supports. O the other hand, if it holds the $4,880 support, there may be a fresh increase above $5,000. The next resistance is near $5,100, above which the price is likely to test the $5,200 resistance.
Looking at the chart, bitcoin price clearly moved into a strong uptrend above $4,500 and $4,650. The current technical structure suggests that the rally could extend above the $5,000 and $5,100 resistance levels. Even if there is a downside correction, buyers are likely to protect the $4,660 and $4,650 supports. To reverse the recent bullish wave, the price must settle below $4,500 and $4,400. Otherwise, bulls are likely to stay in control, eyeing a test of the $5,500 and $6,000 levels in the coming days.
Technical indicators:
Hourly MACD – The MACD is slowly moving into the bearish zone.
Hourly RSI (Relative Strength Index) – The RSI for BTC/USD is currently correcting lower from the overbought zone.
Major Support Levels – $4,880 followed by $4,660.
Major Resistance Levels – $5,000, $5,100 and $5,200.