
Reason to trust
How Our News is Made
Strict editorial policy that focuses on accuracy, relevance, and impartiality
Ad discliamer
Morbi pretium leo et nisl aliquam mollis. Quisque arcu lorem, ultricies quis pellentesque nec, ullamcorper eu odio.
- Bitcoin price corrected lower sharply after trading to a new yearly high at $9,390 against the US Dollar.
- The price remained well bid and it is back above the key $9,000 pivot level.
- There is a crucial bullish trend line forming with support near $8,780 on the hourly chart of the BTC/USD pair (data feed from Kraken).
- The pair is likely to break the $9,260 and $9,300 levels to start the next bullish wave in the near term.
Bitcoin price surged higher above $9,000 and $9,300 against the US Dollar. BTC is currently gaining strength and it is likely to climb further above $9,400 and $9,500.
Bitcoin Price Analysis
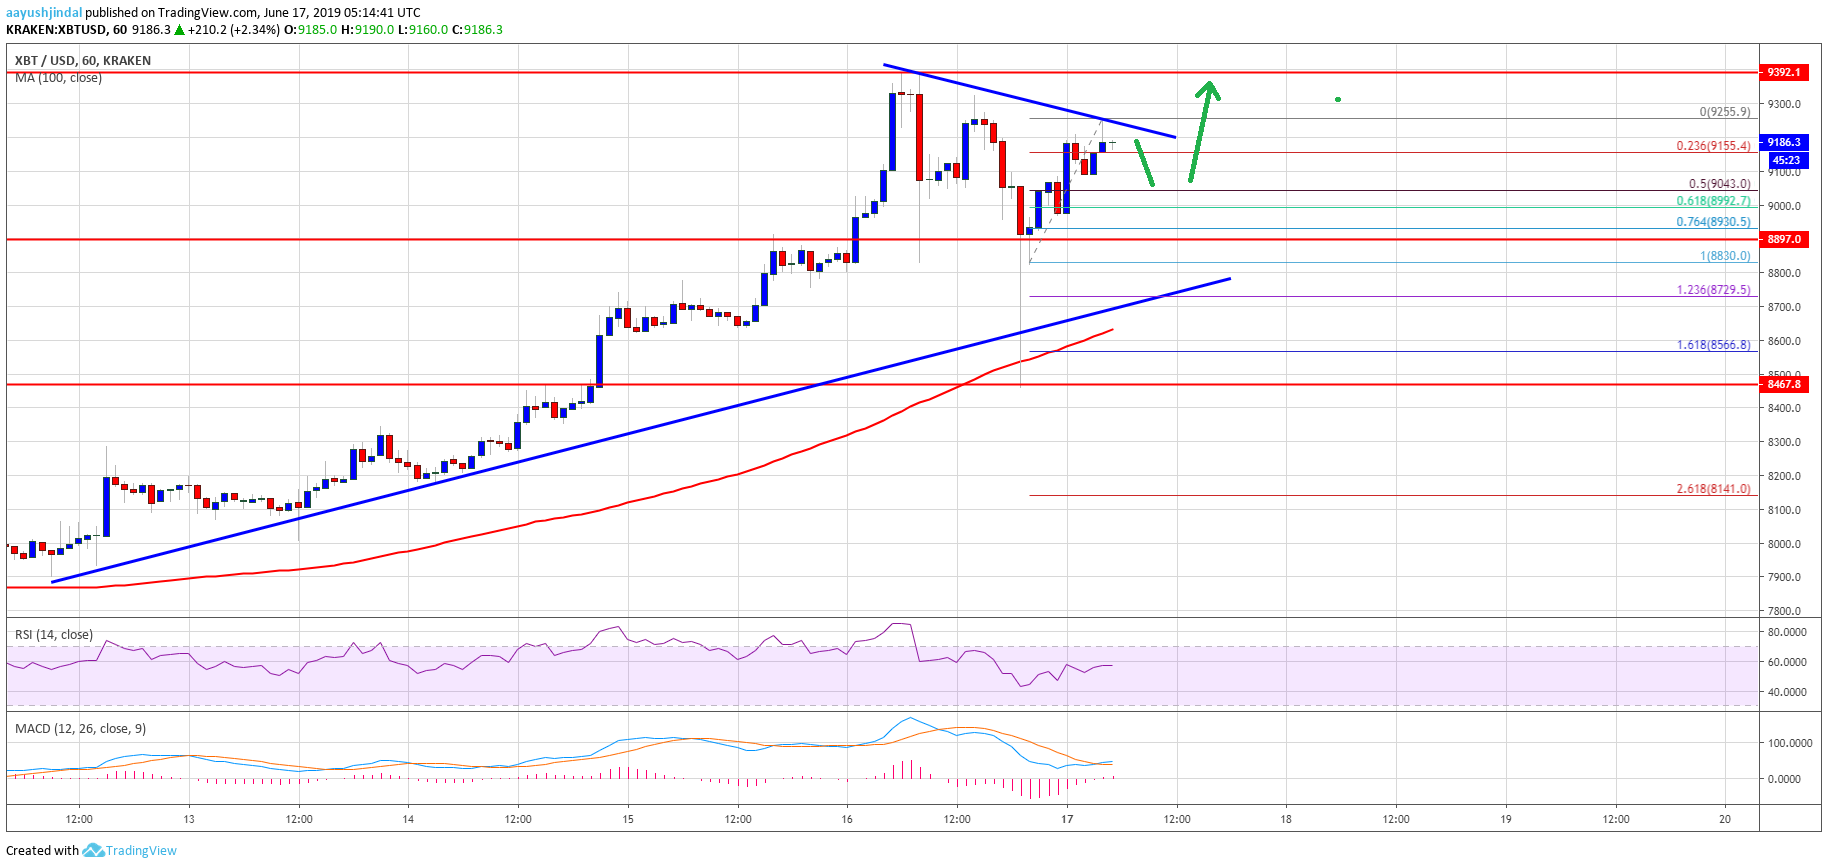
In the past few days, bitcoin price consistently gained pace above $8,800 against the US Dollar. The BTC/USD pair did hit our most bullish targets, including $9,000 and $9,200. It even broke the $9,300 level and settled well above the 100 hourly simple moving average. The recent bullish wave took the price close to the $9,400 level and a new yearly high was formed at $9,392.
After trading as high as $9,392, there was a sharp downside correction. It spiked below the $9,100 and $9,000 levels. However, there was a quick reversal and the price settled above $9,000. Moreover, it climbed above $9,200 and recently formed a swing high at $9,255. It is currently correcting lower and tested the $9,150 level. The 23.6% Fib retracement level of the recent rally from the $8,830 low to $9,255 high is also near $9,155.
On the downside, there are many supports near the $9,100 and $9,050 levels. The main support is near $9,040 and the 50% Fib retracement level of the recent rally from the $8,830 low to $9,255 high is also near $9,155. If there are more downside, the price could revisit the $9,000 support. Besides, there is a crucial bullish trend line forming with support near $8,780 on the hourly chart of the BTC/USD pair.
On the upside, an initial resistance is near the $9,250 and $9,300 levels. If there is an upside break above $9,300 and a connecting bearish trend line, there could be more upsides. The next key resistances are near $9,400 and $9,500.
Looking at the chart, bitcoin price clearly recovered above $9,100 after a sharp downside correction. It is now trading nicely above $9,150 and it is likely to climb further above $9,300, $9,400 and $9,500 in the coming sessions. The main target this week could be $10,000.
Technical indicators:
Hourly MACD – The MACD is about to move back in the bullish zone.
Hourly RSI (Relative Strength Index) – The RSI for BTC/USD is currently well above the 50 level.
Major Support Levels – $9,040 followed by $9,000.
Major Resistance Levels – $9,300, $9,400 and $9,500.


