
Reason to trust
How Our News is Made
Strict editorial policy that focuses on accuracy, relevance, and impartiality
Ad discliamer
Morbi pretium leo et nisl aliquam mollis. Quisque arcu lorem, ultricies quis pellentesque nec, ullamcorper eu odio.
- Bitcoin price surged more than 10% and broke the key $8,000 barrier against the US Dollar.
- The price traded to a new 2019 high close to $8,180 and remains in a strong uptrend.
- There is a short term bullish pattern forming with resistance near $8,050 on the hourly chart of the BTC/USD pair (data feed from Kraken).
- The pair could rally further towards $8,500 once it breaks $8,050 and $8,100.
Bitcoin price rallied significantly and broke $8,000 against the US Dollar. BTC bulls remain in full control and they are likely to target the $8,500 level in the coming sessions.
Bitcoin Price Analysis
There was no stopping bitcoin after it broke the $7,500 resistance level against the US Dollar. The BTC/USD pair started a fresh rally after forming a swing low at $6,995. It broke the $7,200 and $7,500 resistance levels, plus remained well above the 100 hourly simple moving average. Finally, the bulls were able to clear the last swing high near $7,580 and pushed the price towards the $8,000 barrier. There was a clear break above the $8,000 barrier and the price posted a new 2019 high close to $8,180.
Recently, there was a sharp downside correction below $7,850 and the 23.6% Fib retracement level of the upward move from $6,995 low to $8,172 high. The price even dipped below the $7,800 level. However, the $7,600 level acted as a strong support. Besides, the 50% Fib retracement level of the upward move from $6,995 low to $8,172 high acted as a support. The price is now back above $7,800 and $7,950. Moreover, there is a short term bullish pattern forming with resistance near $8,050 on the hourly chart of the BTC/USD pair.
The pair seems to be ready to clear the triangle resistance at $8,050 and trade towards the $8,172 swing high. Additionally, there are high chances of a break above the $8,200 and $8,320 resistance levels. The next stop for the bulls could be $8,500.
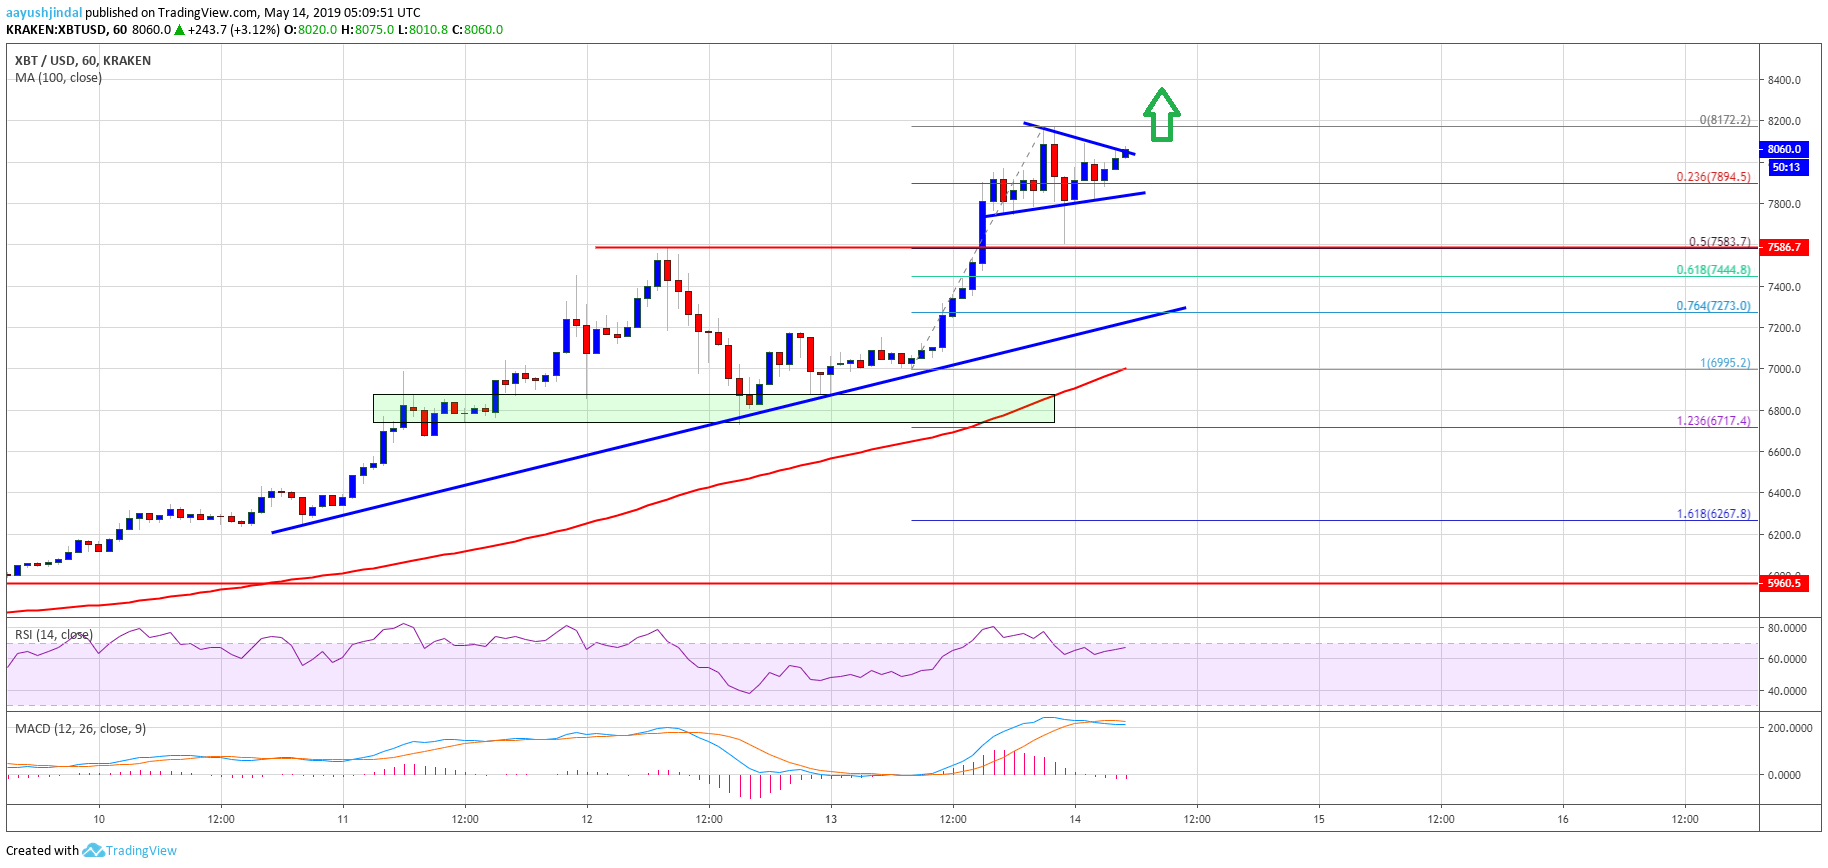
Looking at the chart, bitcoin price is likely setting up for more gains above the $8,050 and $8,150 levels. Conversely, if there is a downside correction, the price may find buyers near the $7,950 and $7,840 levels. The main support for the current wave is near $7,580 (the recent breakout level). The overall price action is super bullish, with technical indicators pointing a run towards $8,500 or even $9,000.
Technical indicators:
Hourly MACD – The MACD is sighting a fresh increase in the bullish zone.
Hourly RSI (Relative Strength Index) – The RSI for BTC/USD is currently well above the 55 and 60 levels.
Major Support Levels – $7,950 followed by $7,840.
Major Resistance Levels – $8,050, $8,170 and $8,320.