
Reason to trust
How Our News is Made
Strict editorial policy that focuses on accuracy, relevance, and impartiality
Ad discliamer
Morbi pretium leo et nisl aliquam mollis. Quisque arcu lorem, ultricies quis pellentesque nec, ullamcorper eu odio.
Bitcoin is struggling to gain bullish momentum above $9,000 against the US Dollar. BTC must climb above $9,200 to set the stage for a rally towards $10,000 in the near term.
- Bitcoin is trading in a broad range below the key $9,200 resistance zone.
- The price is consolidating above $8,800 and the 100 hourly simple moving average.
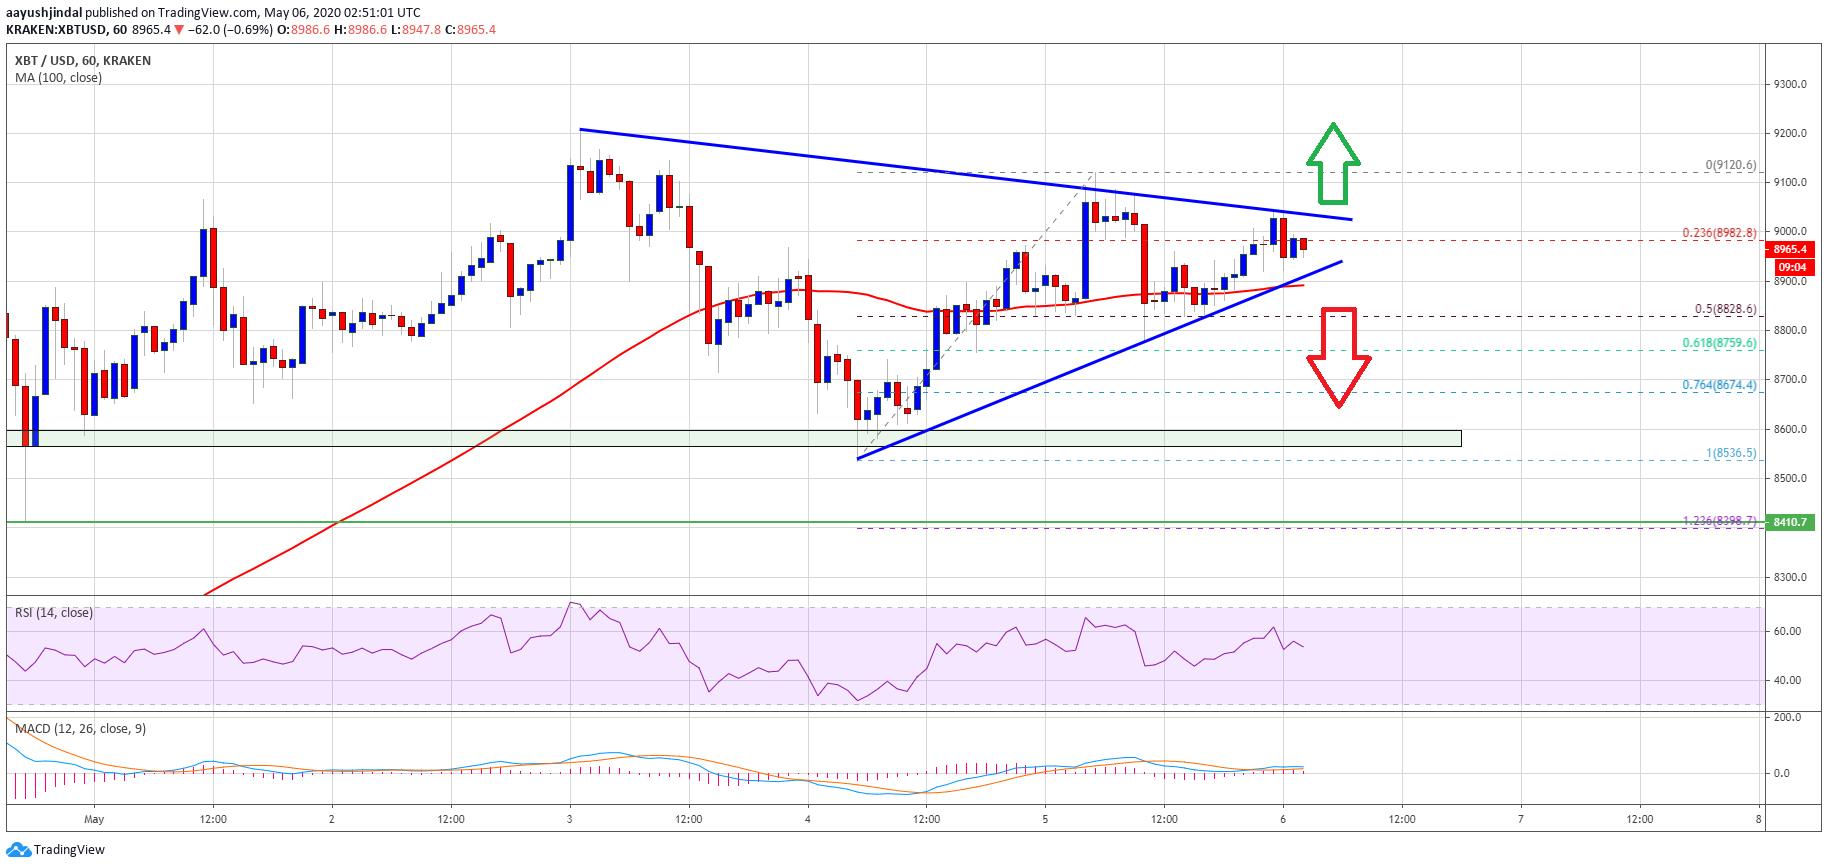
- There is a key contracting triangle forming with resistance near $9,040 on the hourly chart of the BTC/USD pair (data feed from Kraken).
- The pair could either surge above $9,200 or it might start a fresh decline towards $8,400.
Bitcoin Could Gain Momentum
After forming a support base above $8,600, bitcoin started an upward move towards $9,000 against the US Dollar. BTC price broke a few hurdles near $8,950 and the 100 hourly simple moving average to move into a positive zone.
The price even climbed above the $9,000 level and traded as high as $9,120 recently. It is currently correcting lower below $9,000. There was a break below the 23.6% Fib retracement level of the upward move from the $8,536 low to $9,120 high.
On the downside, the $8,800 zone is acting as a strong support along with the 100 hourly SMA. More importantly, there is a key contracting triangle forming with resistance near $9,040 on the hourly chart of the BTC/USD pair.
If bitcoin breaks the triangle resistance and $9,050, it could gain bullish momentum. An initial resistance is near the $9,120 high, above which it could continue to rise towards the $9,200 resistance zone.
To start a strong upward move, the bulls need to clear the $9,200 resistance. If they succeed, the price is likely to rally towards $9,500 or even $10,000 in the coming sessions. An intermediate resistance might be near $9,800.
Bearish Break
If bitcoin price fails to clear the triangle resistance or $9,120, it could start a fresh decline. An initial support is near the 100 hourly SMA, followed by $8,800.
A close below the 100 hourly SMA and $8,800 could increase selling pressure. In the mentioned bearish case, the price might decline towards the $8,600 region or $8,540. The next major support for the bulls below the $8,536 low is near the $8,400 level.
Technical indicators:
Hourly MACD – The MACD is likely to gain pace in the bullish zone.
Hourly RSI (Relative Strength Index) – The RSI for BTC/USD is currently well above the 50 level.
Major Support Levels – $8,800 followed by $8,540.
Major Resistance Levels – $9,050, $9,120 and $9,200.