
Reason to trust
How Our News is Made
Strict editorial policy that focuses on accuracy, relevance, and impartiality
Ad discliamer
Morbi pretium leo et nisl aliquam mollis. Quisque arcu lorem, ultricies quis pellentesque nec, ullamcorper eu odio.
Bitcoin price traded above the $12,000 resistance before starting a downside correction against the US Dollar. BTC is likely to remain supported above $11,650 and it could rise again.
- Bitcoin gained bullish momentum and it broke the $11,800 and $12,000 resistance levels.
- The price traded to a new weekly high at $12,066 and it is well above the 100 hourly simple moving average.
- There is a key bullish trend line forming with support near $11,650 on the hourly chart of the BTC/USD pair (data feed from Kraken).
- The pair is currently correcting lower, but dips might find support near $11,800 or $11,650.
Bitcoin Price Surpasses $12K
In the last technical analysis, we discussed the chances of a break above $12,000 in bitcoin price against the US Dollar. BTC did gain bullish momentum above the $11,800 resistance and settled well above the 100 hourly simple moving average.
It even spiked above the $12,000 resistance and traded to a new weekly high at $12,066. It is currently correcting lower and trading below $12,000. There was a break below the 23.6% Fib retracement level of the recent upward move from the $11,528 low to $12,066 high.
However, the price is now reaching a strong support near the $11,800 level. The previous resistance and a broke channel resistance near $11,840 are likely to prevent more losses. There is also a key bullish trend line forming with support near $11,650 on the hourly chart of the BTC/USD pair.
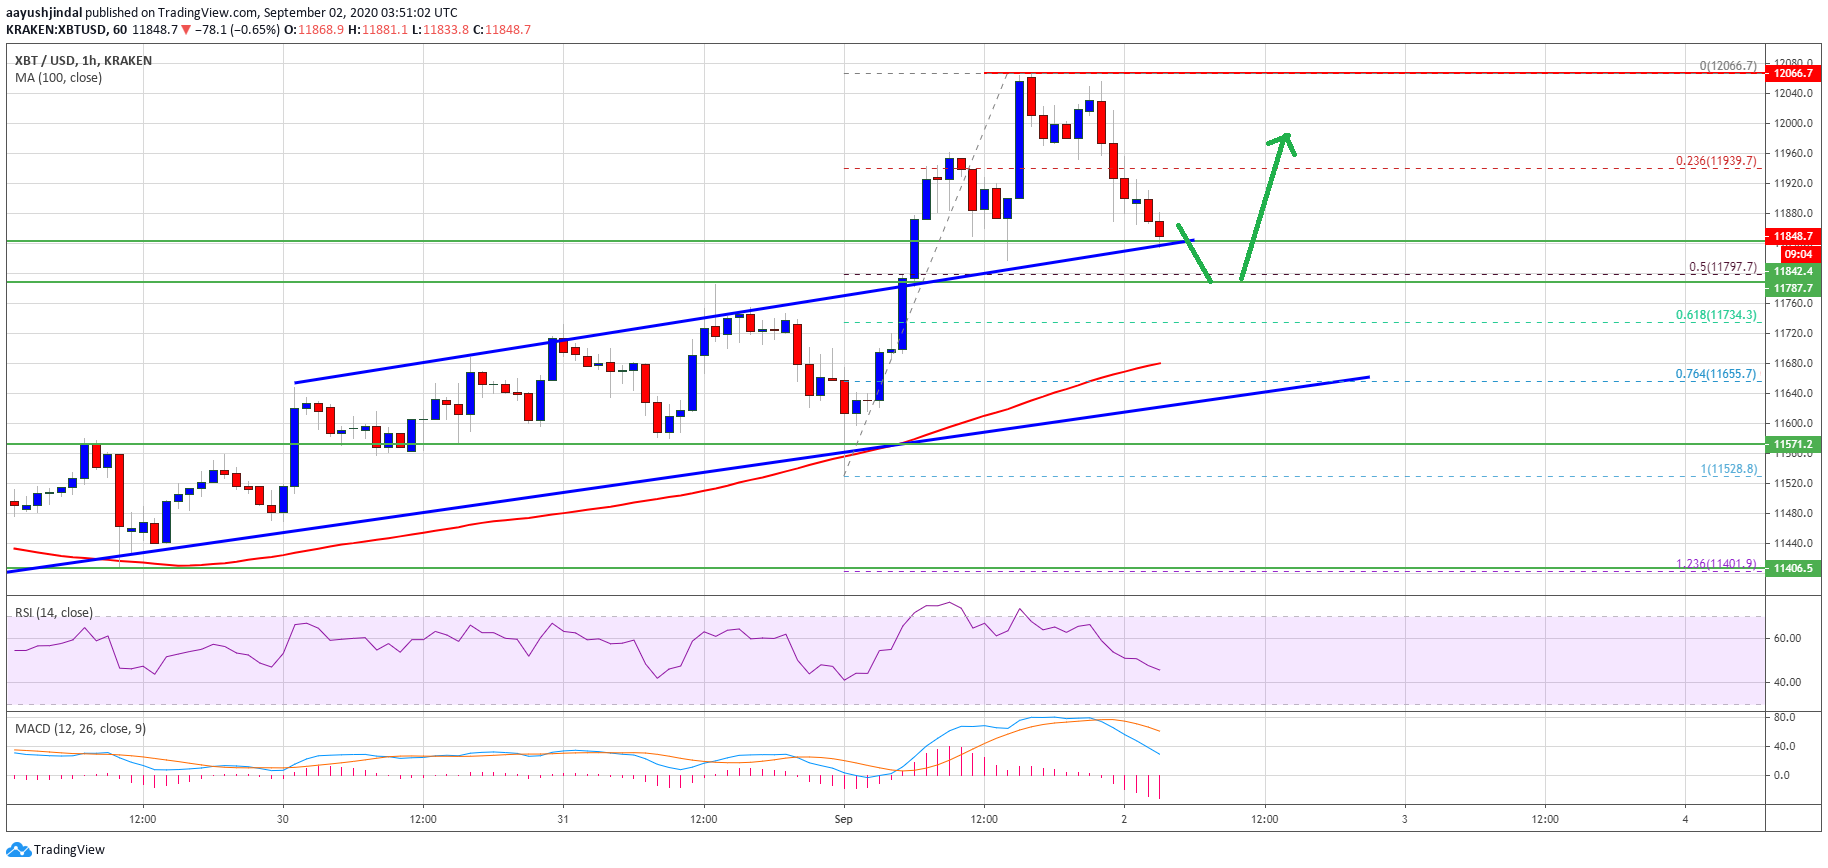
Bitcoin price trades above $11,800. Source: TradingView.com
The $11,800 support is also close to the 50% Fib retracement level of the recent upward move from the $11,528 low to $12,066 high. On the upside, the $12,000 level is still a hurdle for the bulls.
If bitcoin climbs above the $12,000 resistance and the recent high at $12,066, it is likely to accelerate higher. The next resistance is near $12,200, above which the bulls might aim a test of $12,500.
Dips Supported in BTC?
If bitcoin price struggles to clear the $12,000 resistance, it might correct lower further. The main supports are near the $11,800 and $11,650 levels.
A bearish break below the trend line support could push the price towards the uptrend support at $11,550, below which the bulls are likely to struggle.
Technical indicators:
Hourly MACD – The MACD is now gaining momentum in the bearish zone.
Hourly RSI (Relative Strength Index) – The RSI for BTC/USD is declining and it is below the 50 level.
Major Support Levels – $11,800, followed by $11,650.
Major Resistance Levels – $12,000, $12,050 and $12,200.