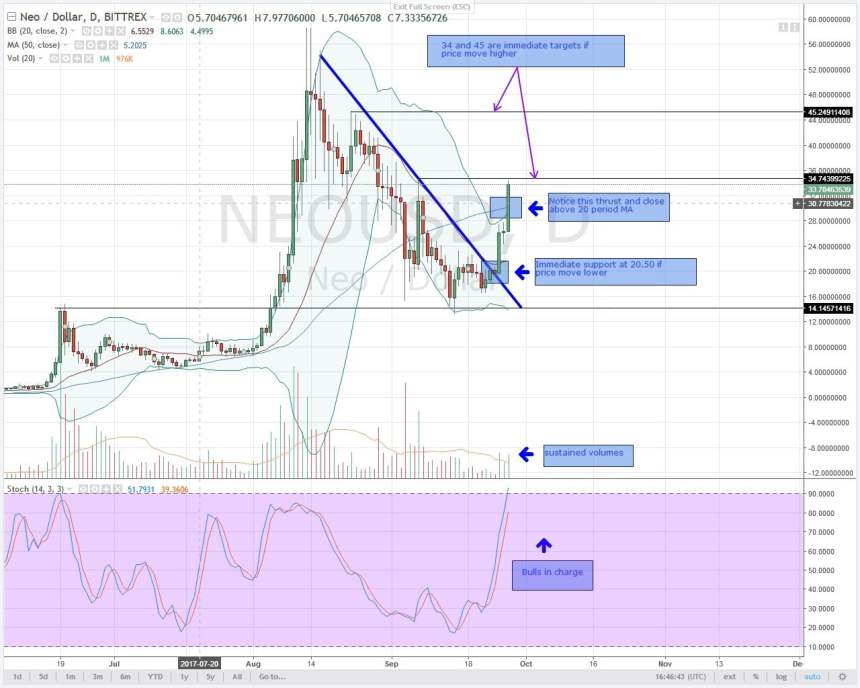
NEOUSD TECHNICAL ANALYSIS
As yesterday’s candles closed, price shifted upwards by $8, a clear indication that bulls were in charge. That was not all, the 20 period MA which is the stochastics middle band was broken and price closed above it. As stochastics buy signal is already in place and bulls marauding-check volume spikes, it’s no brainer that the only profitable move is to go long and aim the second resistance level at 45.00 even though I still expect some reaction at 35. Refer Figure 1 (above): NEOUSD-Daily Chart-28.09.2017
DASHUSD TECHNICAL ANALYSIS
Other than the persistent price stagnation and whipsaws, there was no serious volatility in this pair. The only notable difference is that shift of momentum by stochastics to buy as price action closed yesterday. I will reiterate that unless there is a significant break above or below major resistance or minor support trend line with a volume spike that is when I will initiate a position in that respective direction. So far, I remain on the sidelines observing how supply and demand balance each other. As observed, out of 9 trading days, 6 days have closed as dojis in a tight range between $311-lows on 19.09.2017 and $371 highs of 21.09.2017.
IOTUSD TECHNICAL ANALYSIS
As yesterday’s bullish candlestick closed, it was apparent that the 50 period MA, the minor support trend line and reducing volatility all contributed to a range-bound price action over a 3 trading day period-from 25.09.2017-27.09.2017. During that time price moved $0.05 with mixed stochastic signals and subdued volumes. However, as the markets opened today, a clear buy signal has formed and only a break and close above 0.56 means we aim at $0.63 which is a resistance line and a bull target.
MONERO-XMRUSD TECHNICAL ANALYSIS
Price action is charting higher in this pair and most importantly, price action closed above that 30-day resistance trend line. The minor support trend line drawn between 22.09.2017 and 26.09.2017 lows stand and form a base for upwards movement. As yesterday’s candle closed, the price has tested the 50 period MA at $100 and as momentum shift higher, more buyers will jump in and propel price towards the first resistance line at $107.
NEMUSD TECHNICAL ANALYSIS
As price action closed on Wednesday, two things happened. The minor support trend line held steady for the 5th time in 12 trading days and at the same time price action closed above the major resistance trend line and the 50 period MA after 27 trading days. Bulls are in charge as stochastics shows but then a confluence of different lines means 0.25-0.27 is a resistance zone where a strong reaction is expected. From the chart, this is where the major support turned resistance trend line meets with the 20 period MA. It is also a zone where the price was rejected on several occasions in the past two months. Because of yesterday’s bull bar, I will enter long in the lower time frame and aim for $0.27 and $0.30
Contributed by Dalmas Ngetich, an expert with 3 years in Forex, Commodity and Cryptocurrency trading. All charts, courtesy of Trading View
