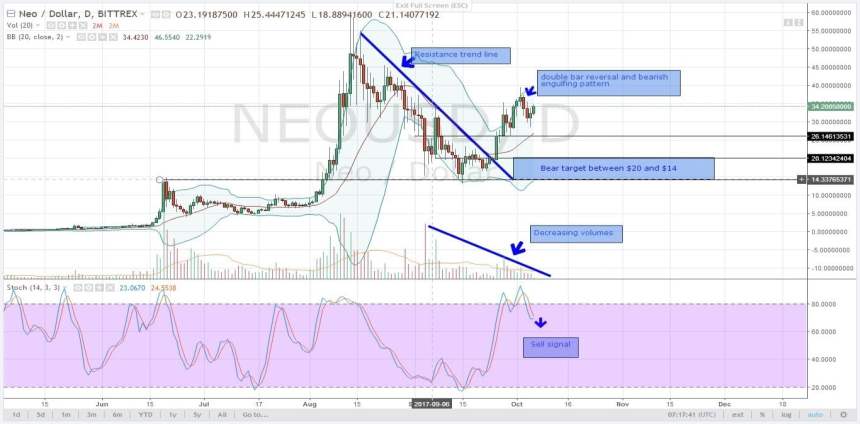
NEOUSD TECHNICAL ANALYSIS
Today’s chart is still contained within yesterday’s Hi-Los of $33.89 and $28.60. From the look of things, there is some buying pressure after yesterday’s bull candlestick. Going into NFP later today, we expect volatility either to the upside especially if NFP numbers disappoint investors and that will entirely be a fundamental event. On the flip side, in-case of the improved labor market, USD demand will surge and yesterday’s minor support of $26 will likely be broken. Either way, we expect consolidation before NY open and that means 04.10.2017 highs of $35 will be our immediate resistance. Ref (above) Figure 1: NEOUSD-Daily Chart-06.10.2017
DASHUSD TECHNICAL ANALYSIS
Depending on how you would want to analyze this pair, 04.10.2017 highs of $322 is still a minor resistance level. It is also within the 50 period MA which has been a ceiling for 6 trading days after it was breached on 30.09.2017. It is easy to note that price action is trending within a tight $37 range with higher highs and lower highs in lower time frames. Since there is a stochastics buy signal and bullish candlesticks, our trigger points will be set at $322 and $285 support. Any close outside of this range will entail a breakout and we shall initiate trade in that direction.
IOTUSD TECHNICAL ANALYSIS
It has been two trading days of pure horizontal consolidation for this pair. Resistance is at $0.56 with support at $0.52. It is worth noting that even today, price action bounced off from around support with no buying pressure at all but ended up testing $0.56. No-one knows but it might also end up testing support turned resistance trend line at $0.58. Stochastics is bearish pumped by below average volumes which is, in turn, pushing prices lower. So, depending on your risk-off, I will recommend taking profits and steering clear of this pair until a clear trend is defined. Alternatively, you can move your stop loss to break even and aim anywhere between $0.45 and $0.36 as maintain our bearish skew.
MONERO-XMRUSD TECHNICAL ANALYSIS
Other than that clear squeeze in which price is trending at, price action is oscillating inside a wedge. We can talk about that 50 period MA which has been a resistance level over 8 trading days but our interest will be that resistance trend line drawn from 28.08.2017 and 27.09.2017 highs. As history shows, there is price rejection at support trend line at around $90. Yesterday, prices actually pushed higher from support forming a doji as the day closed. With US economic data in the pipeline today, I expect a breakout and improved participation going forward. After today, we initiate a trade based on the new price trend and a convincing break below $86 support or above $96 resistance zone.
LSKUSD TECHNICAL ANALYSIS
Before today, we have two candlesticks bouncing off the 50 period MA with an immediate test of 04.09.2017 and 03.10.2017 lows of around $5. Before testing $5, the price should break below that wedge to the downside. Since there is no activity and volume is somehow muted, I remain bearish and retain my bear projections since stochastics are still bearish.
Contributed by Dalmas Ngetich, an expert with 3 years in Forex, Commodity and Cryptocurrency trading. All charts, courtesy of Trading View
