NEOUSD TECHNICAL ANALYSIS
Yesterday’s recommendation remains unchanged partly because there was nothing that could warrant an alternative view. Price movement was tight at $3 and buy pressure sustained as evidenced by those long lower wicks as yesterday’s candle closed. As you can see, $35 resistance level is still relevant and surprisingly yesterday’s highs matched 30.09.2017 highs of $34.69. Technically, stochastics %k and %d are diverging with a buy signal in place but then the “supposed” push higher is supported by half the volume at around 450K which is half the 20 period average of 850K. Therefore, our support resistance at $26, $35 remains our trigger levels just in-case this buying trend continues or conversely if price action decides to dip. Refer to Figure 1 (above): NEOUSD-Daily Chart-02.10.2017.
DASHUSD TECHNICAL ANALYSIS

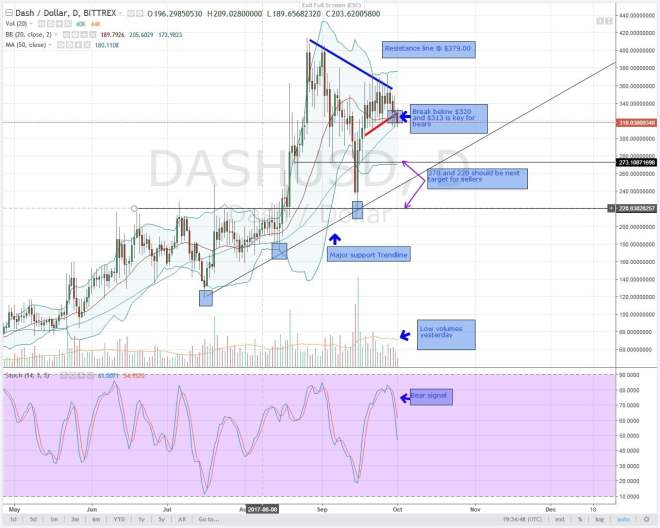
For now, that resistance level at $379 will be canceled and placed only if price turns and close above $360. For intra-day traders, yesterday was pretty profitable as price action turned lower and broke below minor support level marked at $320. Furthermore, as $320 coincides with the 20 and 50-periods MA, some minor price rejection was expected as observed because sellers were pushing prices lower. In the secondary chart, a stochastic sell signal has been printed and accompanied by diverging %k and %d hinting bear momentum. However, yesterday’s sell momentum was weak because of low volumes-at 20K which is below 60K daily average. Therefore, unless otherwise, the USD is drawing demand and today is another day to sell DASH with the first take profit level at $273.
IOTUSD TECHNICAL ANALYSIS

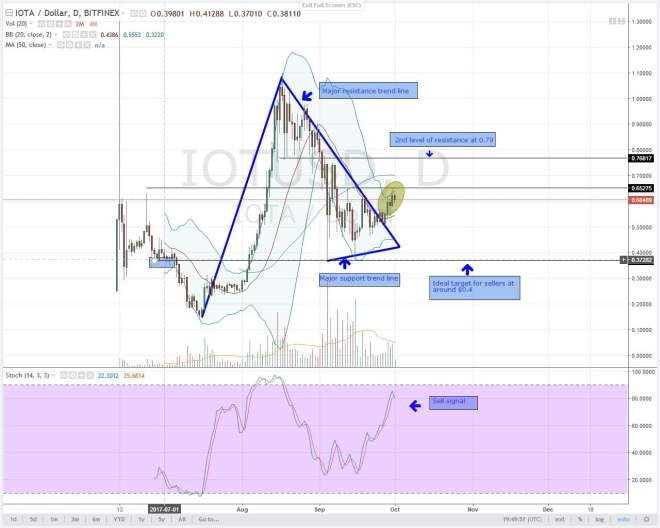
Advised by fundamental news expected this week from the US, investors should reduce their IOT exposure. Caution should be practiced because yesterday’s price action reacted to 05.09.2017, 12.09.2017 and 30.09.2017 highs of $0.65 and moved lower. That stochastics sell signal at the overbought territory pours cold water on the bullish rally after their $0.10 appreciation over 4 days. Therefore, it will be wise to unwind longs and take a wait-and-see approach for any break above $0.65. However, if there is a lower low and a break below 50-period MA at $0.53, investors should place sell trades. In that case, June and September 2017 region of support at $0.40 should be ideal take profit zone.
MONERO-XMRUSD TECHNICAL ANALYSIS

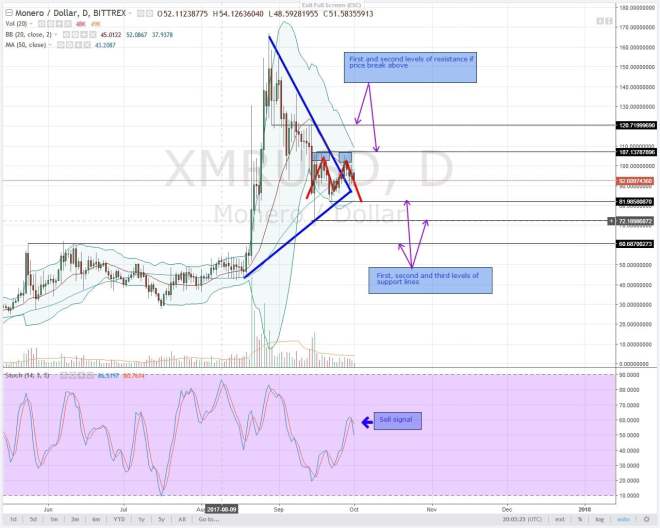
17.09.2017 and 27.09.2017 highs of $107 acted as double tops and so far, price broke and closed below yesterday’s minor support trend line of $96. Going by the double tops and the resulting M-formation, the price has to somehow test support line marked around $80. If bears sustain their push with increasing volumes, the second and the third levels of resistance at $70 and $60 should be hit. For now, bears are in charge and sellers should initiate shorts in lower timeframes.
NEMUSD TECHNICAL ANALYSIS

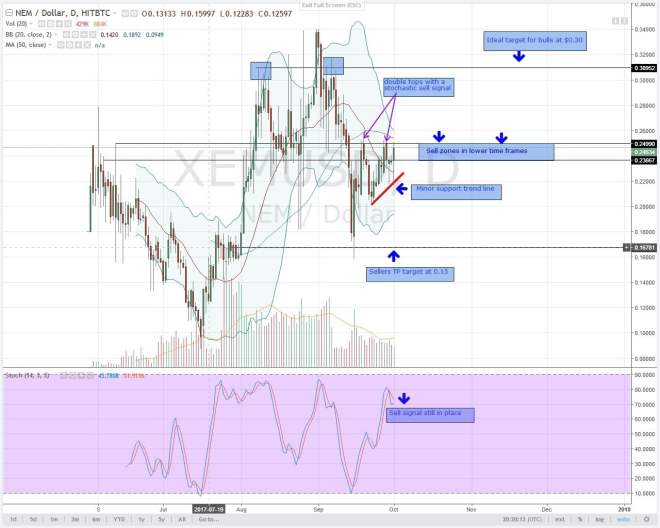
On 30.09.2017, bears were in charge and as trend followers, yesterday presented a perfect opportunity for calculating bears to profit by shorting in lower time frames. However, as 01.10.2017 candlestick closed, most stop losses at $0.24 were hit. For now, price action is retesting that double- turned-triple top of $0.25. I will place a sell trigger below 01.10.2017 lows of $0.21 just-in-case market turns bearish again. Price breakout above $0.25 with above-average volumes-ideally above 1M- means buyers are in charge and I will aim at $0.30. Since there is a stochastics sell signal at overbought territory, I will maintain my bearish predisposition and wait for a break below $0.21 and enter short with taking profit around $0.15.
Contributed by Dalmas Ngetich, an expert with 3 years in Forex, Commodity and Cryptocurrency trading. All charts, courtesy of Trading View


