After weeks of consolidation, Bitcoin decisively broke below $9,000 just minutes ago. The cryptocurrency dipped as low as $8,840 on leading spot exchanges and slightly lower on margin-enabled exchanges like BitMEX.
BTC price chart of the drop from TradingView.com
This move caught many traders off guard, according to derivatives data.
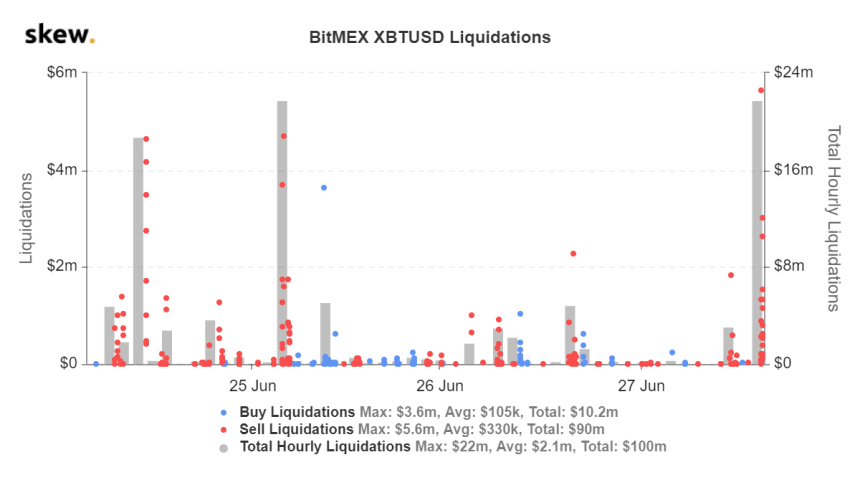
Skew.com reported that more than $20 million worth of longs on BitMEX alone were liquidated during this move lower. This adds to the approximately $50 million in longs liquidated earlier this week as the cryptocurrency slid from ~$9,400 to $9,000.

Bitcoin position liquidation chart for BitMEX from crypto derivatives tracker Skew.com
BitMEX’s Ethereum market has also sustained damage. The derivatives tracker has reported liquidations of $1 million worth of ETH contracts.
Considering that these are just two markets of a broader crypto derivatives industry, there were likely dozens of millions more liquidated.
Related Reading: Crypto Tidbits: Bitcoin At $9k, Grayscale Ethereum Trust, Cryptocurrency & PayPal
A Bigger Bitcoin Drop Is on Its Way
Analysts say that this weakness could be a precursor to an even greater drop.
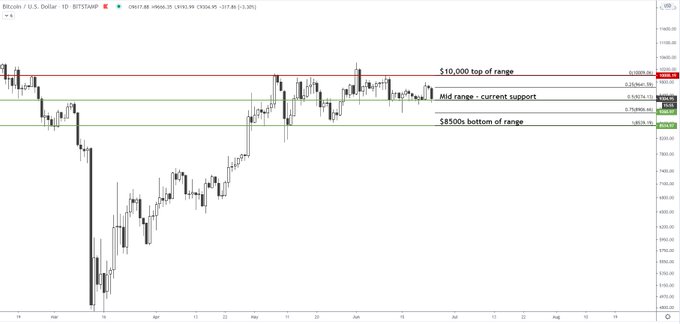
Blockroots founder Josh Rager said last week that Bitcoin breaking $9,100 will lead to a move to $8,900 and $8,500. Should Rager’s analysis continue to hold true, a move towards $8,500 will follow in the coming hours and days:
“BTC’s range is clear. Current support that has been holding the past three weeks is the mid-range Break down here and price likely to see $8900 followed by $8500 range bottom,” Rager wrote, referencing the chart seen below.
Chart of BTC’s price action over recent months by Josh Rager (@Josh_rager on Twitter). Chart from Tradingview.com
There are others expecting a further move to the downside.
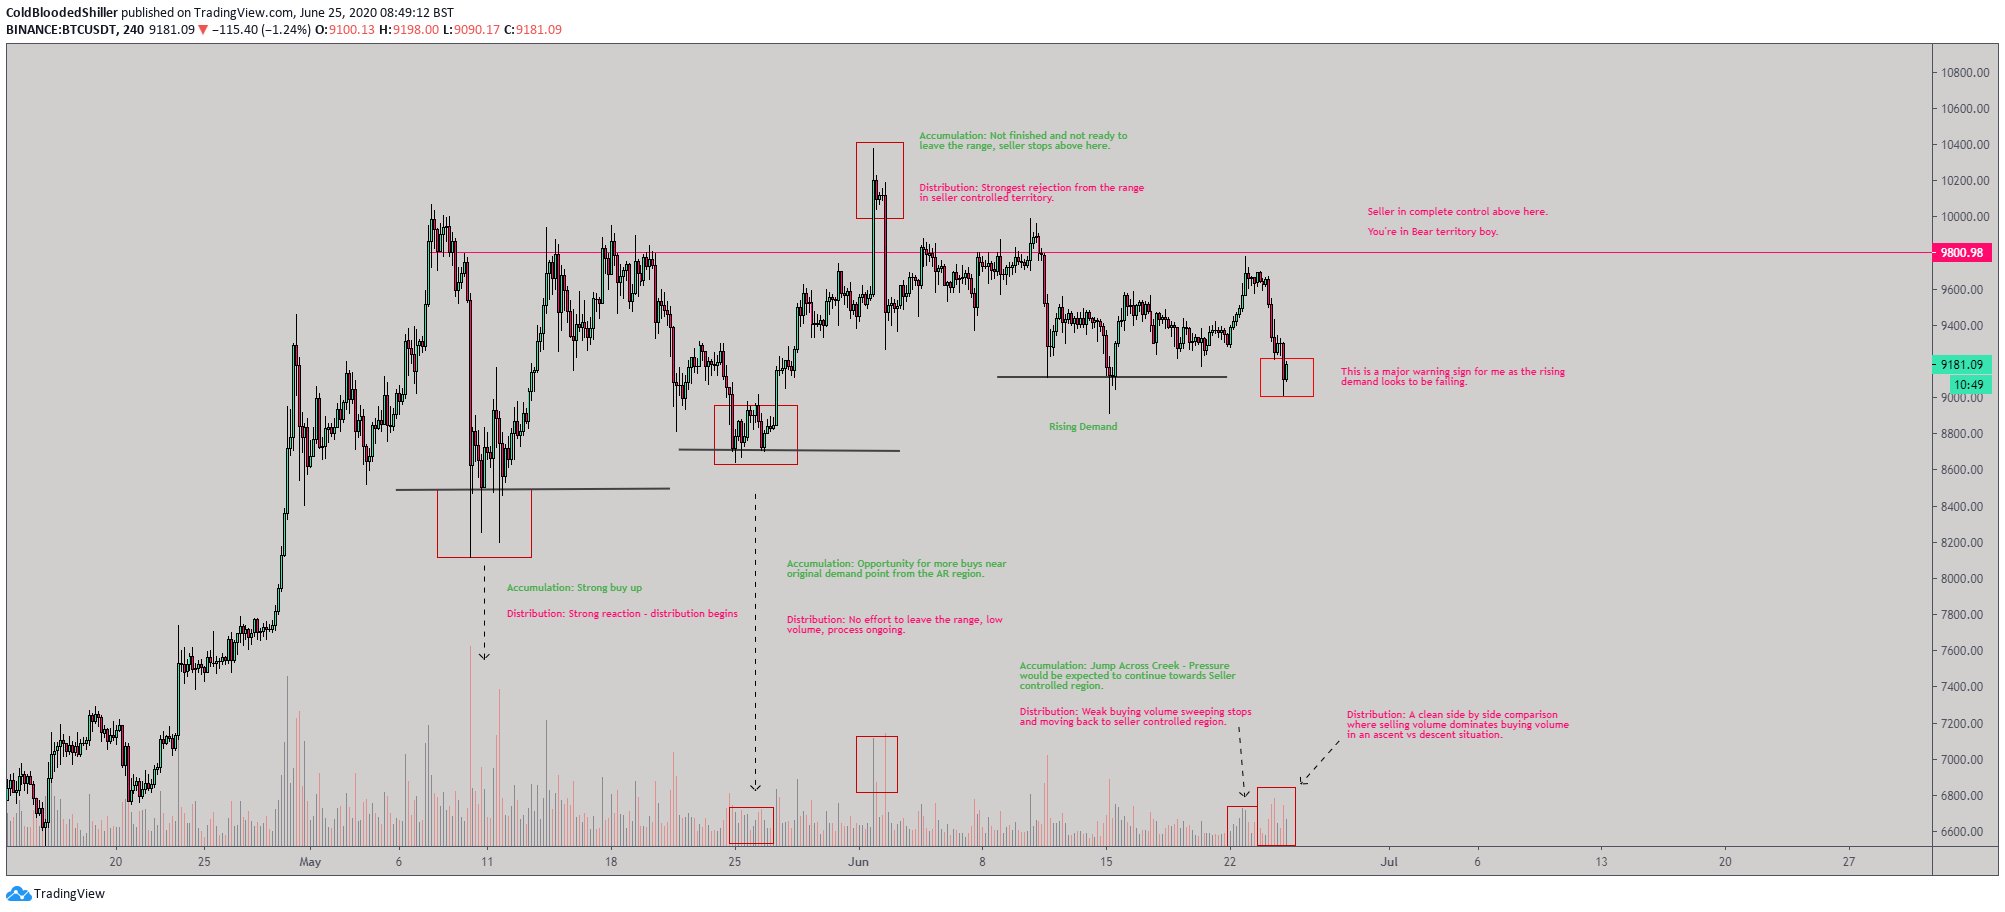
One trader argued on June 25th that Bitcoin is currently trading in a textbook Wyckoff Distribution. A Wyckoff Distribution is a bearish chart and volume pattern that appears near the tops of bull trends.
“A couple more clues developing that lend themselves to HTF distribution. 1. Rising Demand on the verge of failing. 2. Side by side, ascent vs descent with selling the dominant pressure from volume. We break to the downside, I’m not interested in $7ks. Much lower,” the analyst wrote, referencing Bitcoin’s recent weakness.
BTC distribution analysis posted by “Cold Blooded Shiller” (@Coldbloodshill on Twitter). Chart from TradingView.com
Corroborated by Fundamentals
The bearish analyses shared by these traders can be corroborated by fundamental trends.
As reported by NewsBTC previously, on-chain analyst Cole Garner noted that BTC’s next “big” move is likely to be to the downside. He attributed this sentiment to growing sell-side pressure from miners, weak buy orders on Bitfinex, and institutions being net short on Bitcoin via the CME.
Not to mention, the multi-billion-dollar crypto scam, PlusToken, has distributed cryptocurrency to wallets. DTC Captial’s Spencer Noon has reported that the sum PlusToken is trying to liquidate is cumulatively worth $450 million.
Featured Image from Shutterstock
Price tags: xbtusd, btcusdt, btcusd
$20 Million in BitMEX Longs Wiped as Bitcoin Crashes Below $9,000


