Reason to trust

How Our News is Made
Strict editorial policy that focuses on accuracy, relevance, and impartiality
Ad discliamer
Morbi pretium leo et nisl aliquam mollis. Quisque arcu lorem, ultricies quis pellentesque nec, ullamcorper eu odio.
The MATIC price recently broke above a key resistance level, indicating a positive development. However, its price appreciation over the past week has been modest, with only a 2% increase. MATIC has remained close to a critical support line on its daily chart despite the breakout.
The technical outlook suggests that recovery might take some time as the bears dominate the price. Both demand and accumulation have decreased in the daily timeframe.
While MATIC currently sits above an important resistance, the absence of buyer support could lead to a significant loss in value before any recovery occurs on the daily chart.
If the bears exert further pressure, MATIC will likely resume sideways trading, fluctuating between $0.81 and $0.84. The uncertainty in the Bitcoin price movement, as it fluctuates from $27,000 and retraces from that level, has impacted altcoins, weakening their respective price action. The MATIC market capitalization has fallen, indicating a higher level of selling activity than buying activity.
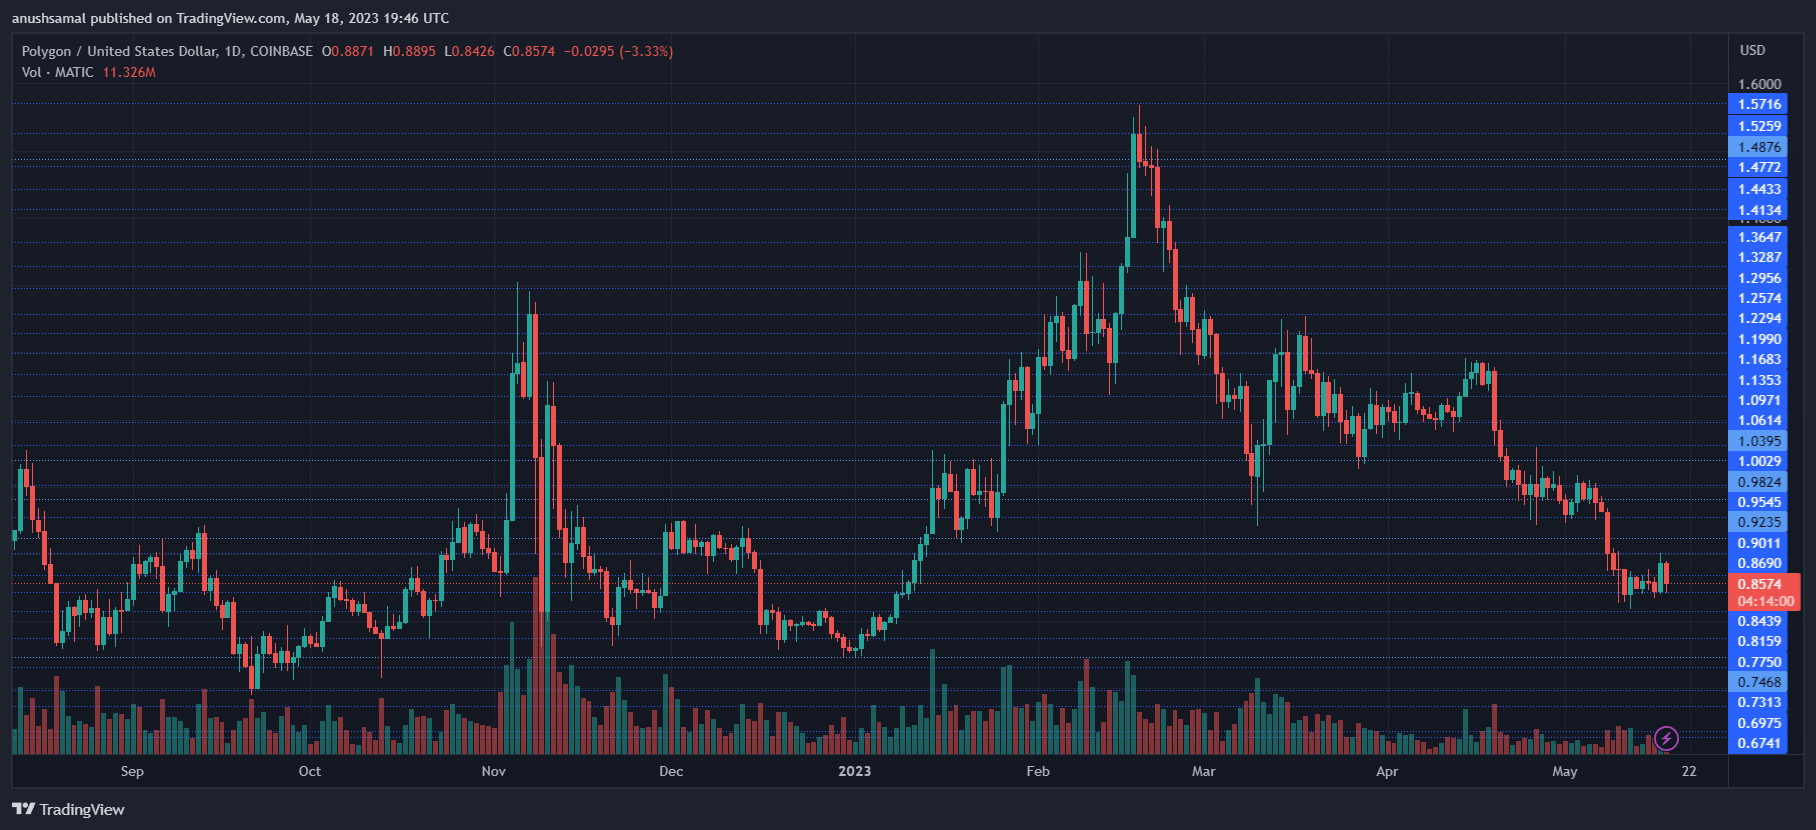
MATIC Price Analysis: One-Day Chart

At the time of writing, MATIC was trading at $0.86. It successfully surpassed the $0.84 resistance level in the short term, but buyer sentiment remained weak. The coin’s next significant resistance is $0.87, and breaching this level could initiate a recovery trend.
However, if sellers persist, the altcoin could drop toward $0.81 and potentially below $0.80. The key for the bulls to regain control of the price lies in MATIC, staying above $0.86 in the upcoming trading sessions. The trading volume of MATIC in the last session was low, indicating a lack of buying strength.
Technical Analysis

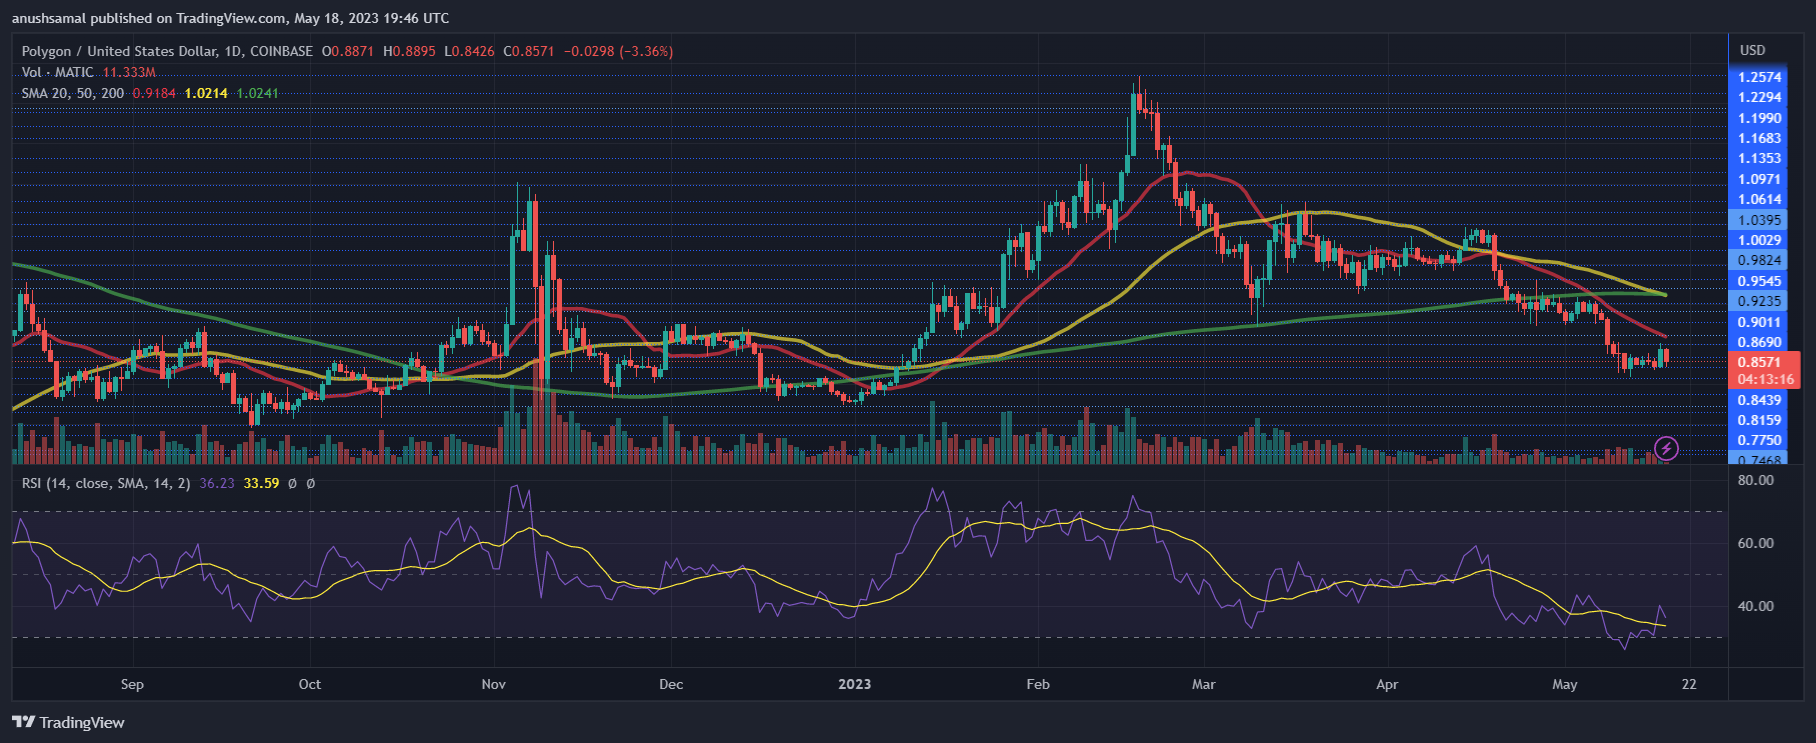
MATIC faced challenges in generating strong buying support throughout April and May, resulting in reduced demand. The Relative Strength Index (RSI) indicated a decline, with the indicator remaining below 40, highlighting the dominant presence of sellers in the market.
Furthermore, the price dropped below the 20-Simple Moving Average (SMA) line, indicating that sellers were driving the price momentum. However, if MATIC surpasses the $0.87 level, it will trade above the 20-SMA line.

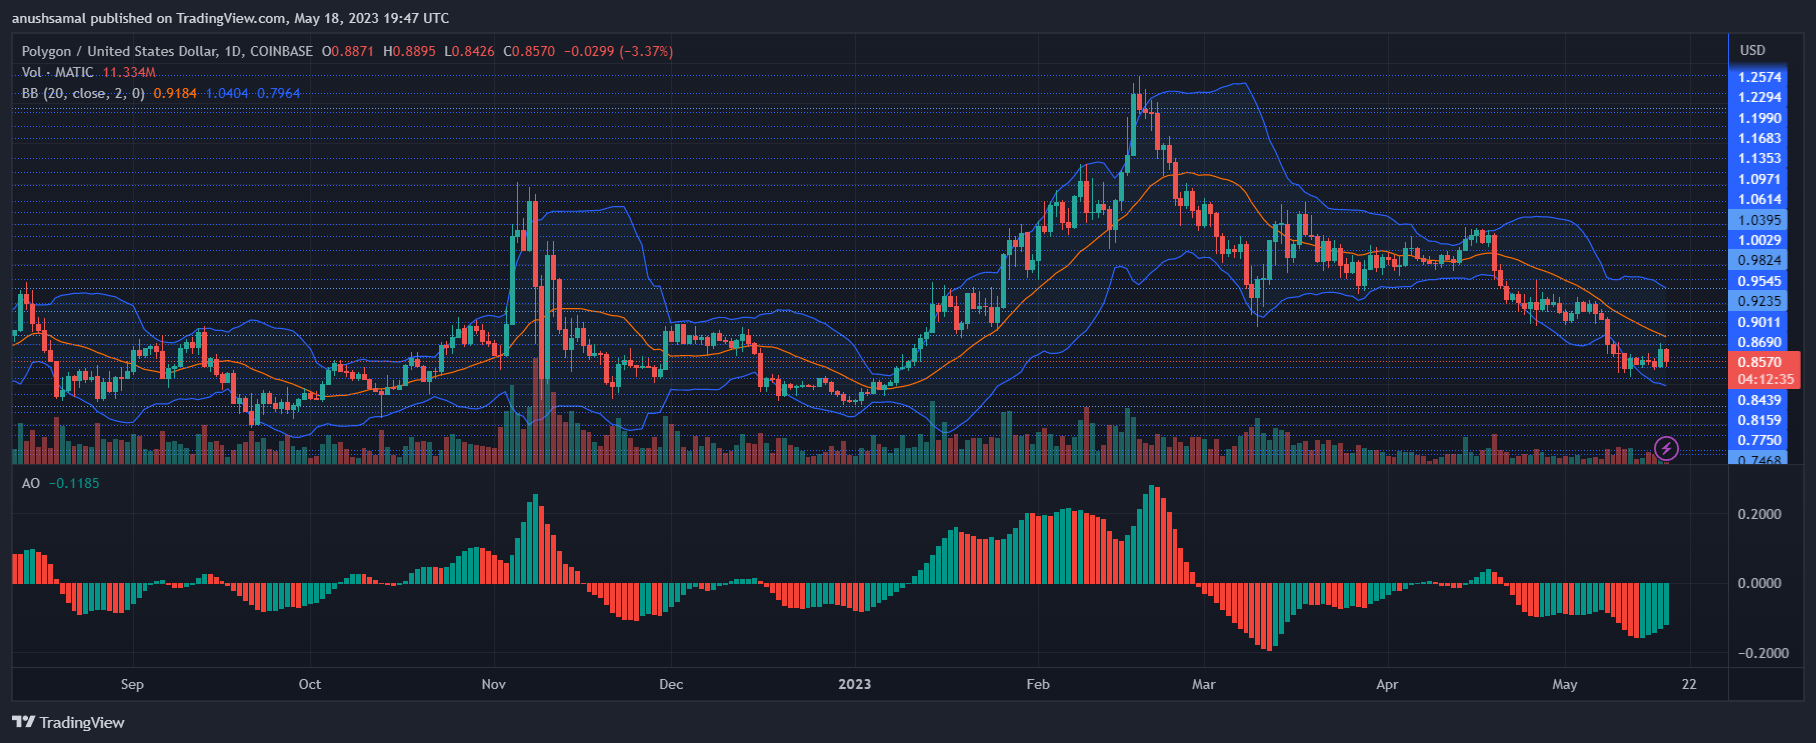
In contrast, the altcoin exhibited buy signals on the daily chart, albeit with a diminishing size and strength. The presence of green histograms on the Awesome Oscillator indicated buy signals for the altcoin, reflecting price momentum and potential reversals.
Additionally, the Bollinger Bands, which measure price volatility and the likelihood of price fluctuations, remained narrow and wide. However, the bands had a slight convergence, suggesting that the price may not undergo significant volatility or fluctuation in the immediate trading sessions.


